Century 21 People’s Choice Realty Inc., Brokerage
120 MATHESON BLVD E #103
MISSISSAUGA, Ontario
L4Z 1X1
Toronto, West Humber-Clairville, M9V 1Z4
$999,000
Listed by ROYAL LEPAGE REAL ESTATE SERVICES LTD..
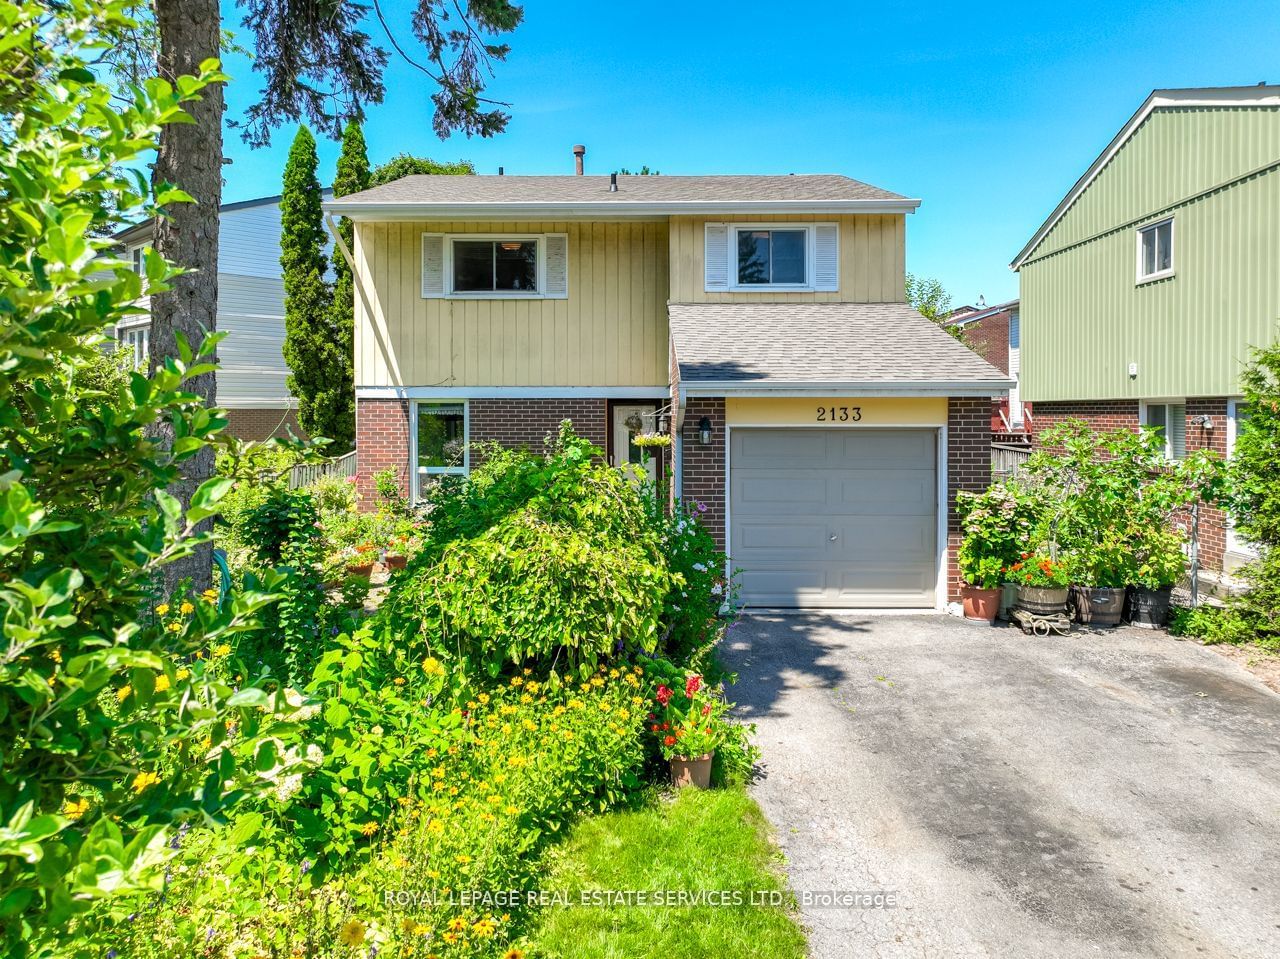
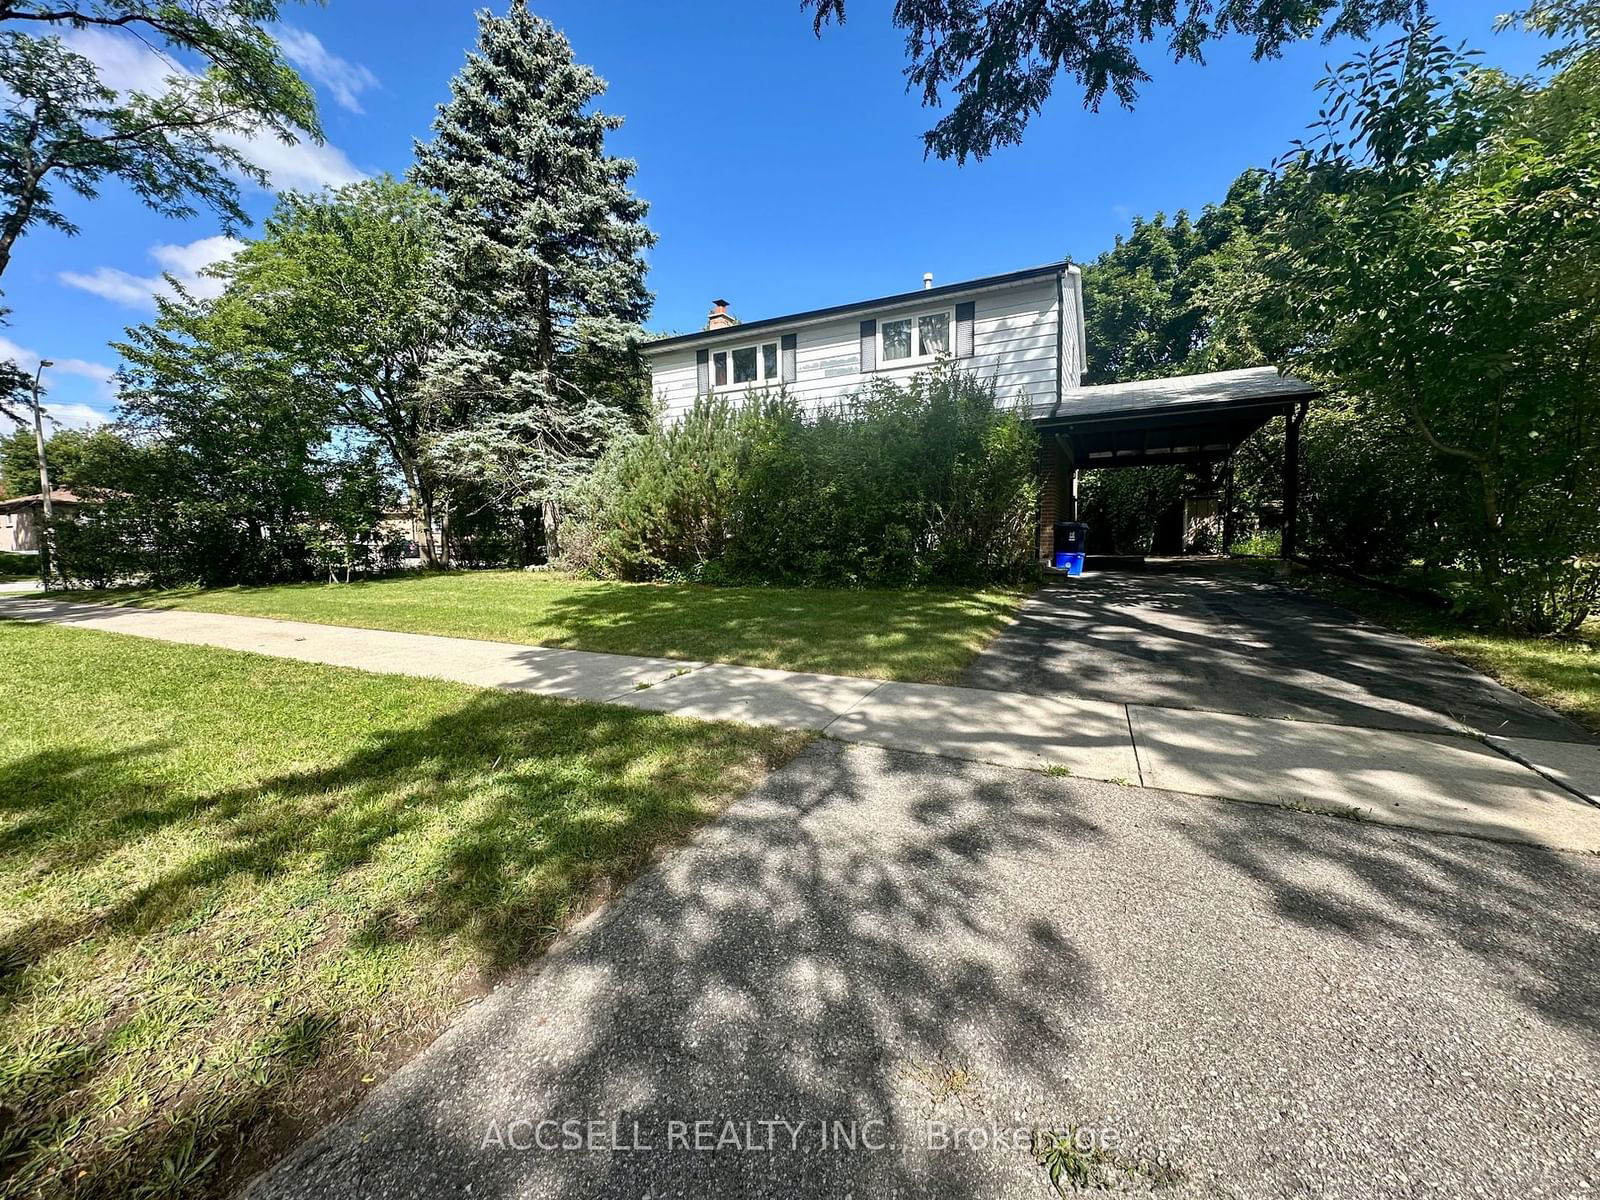
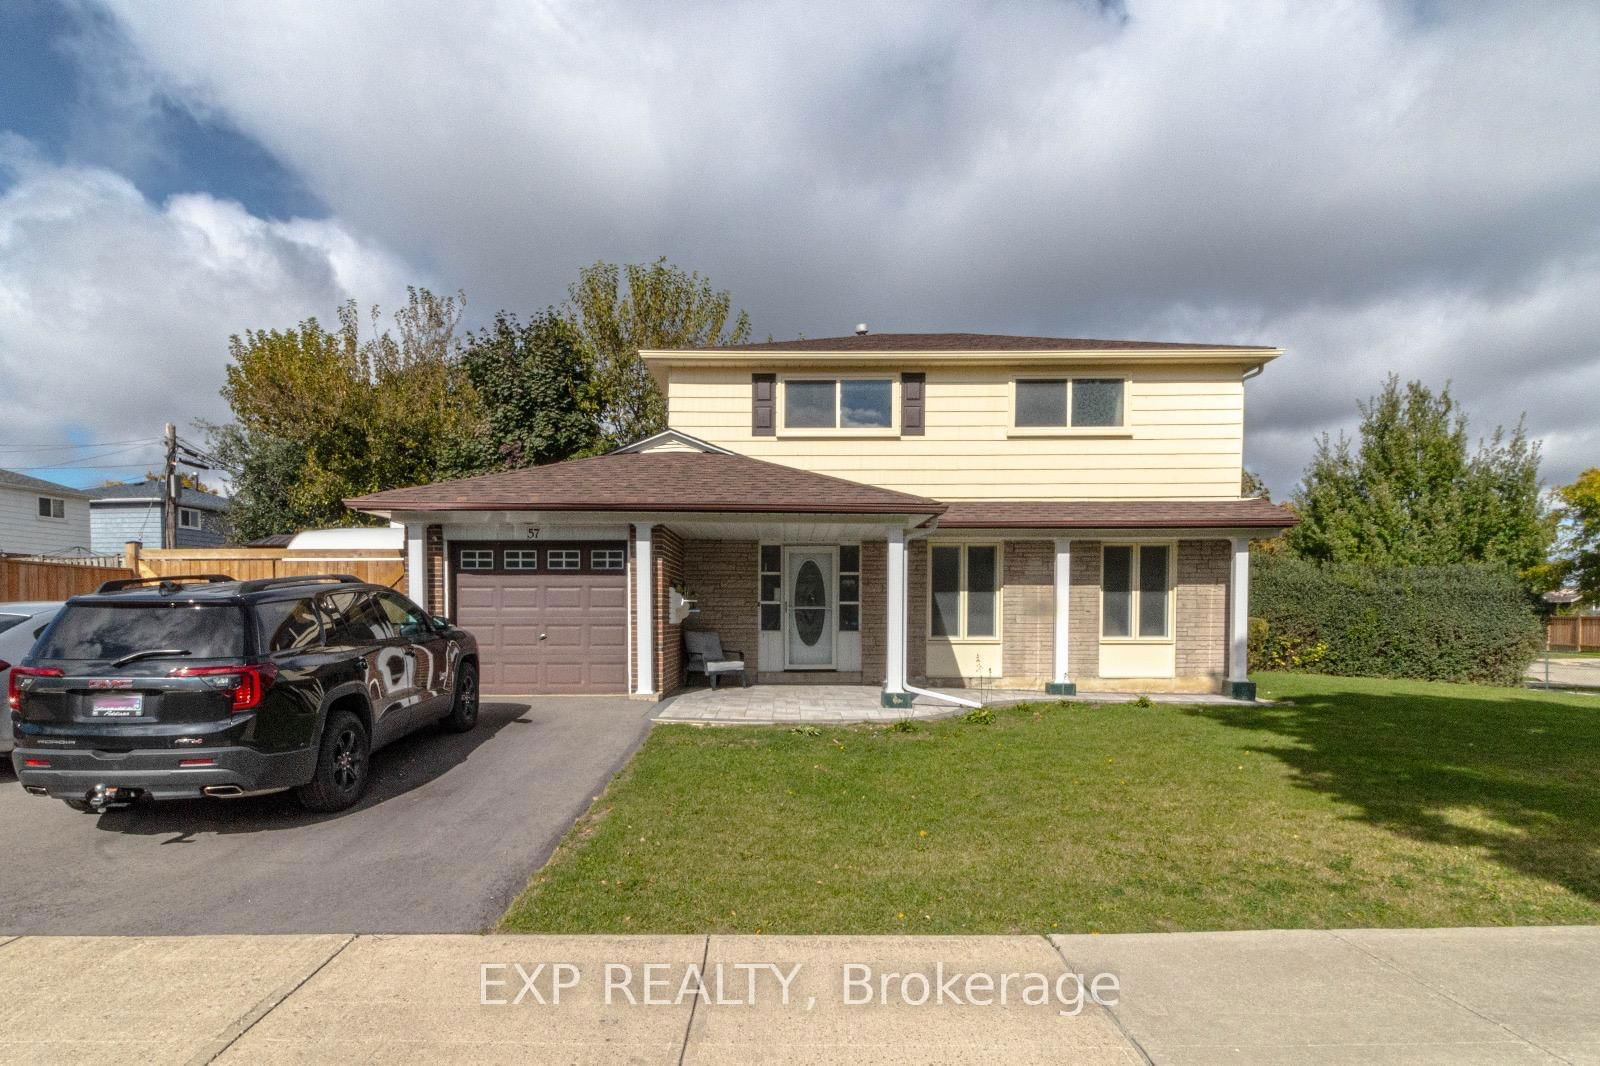
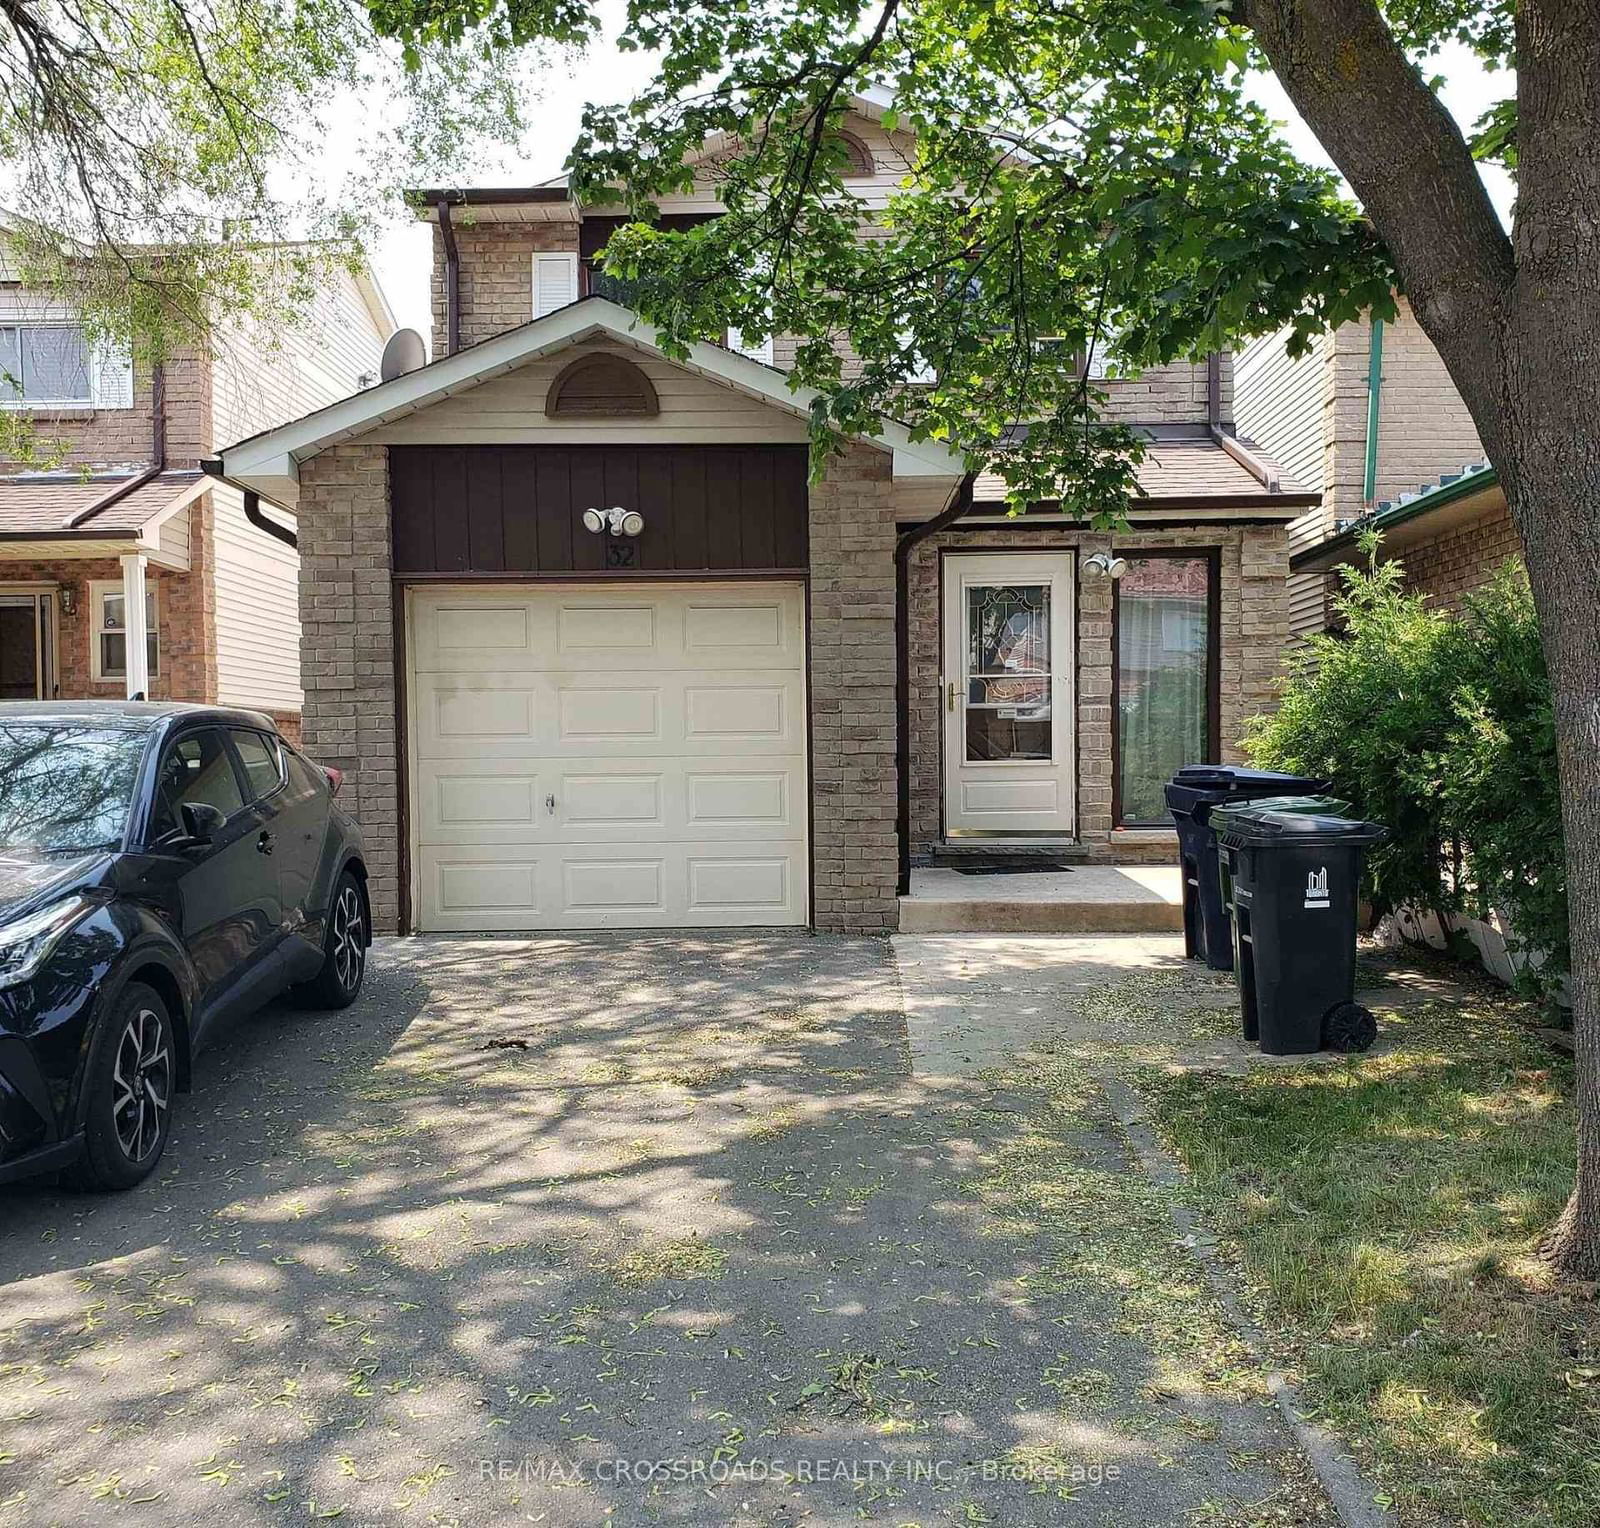
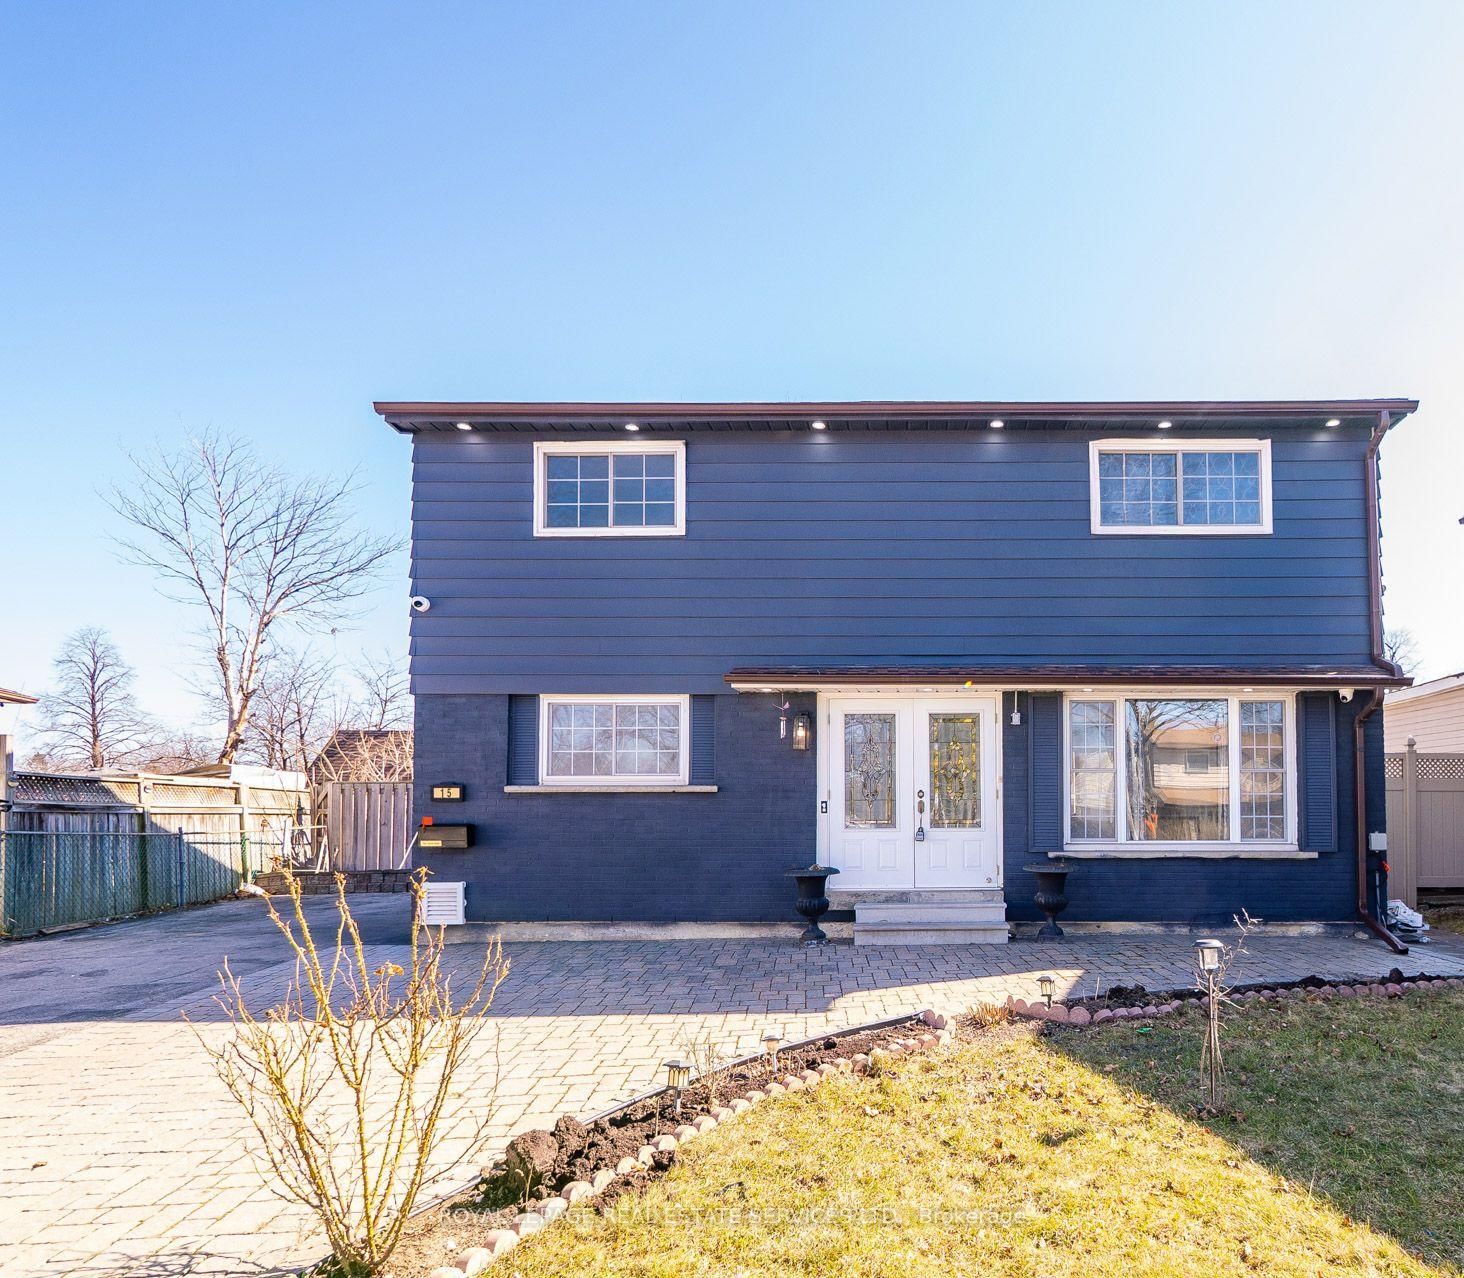
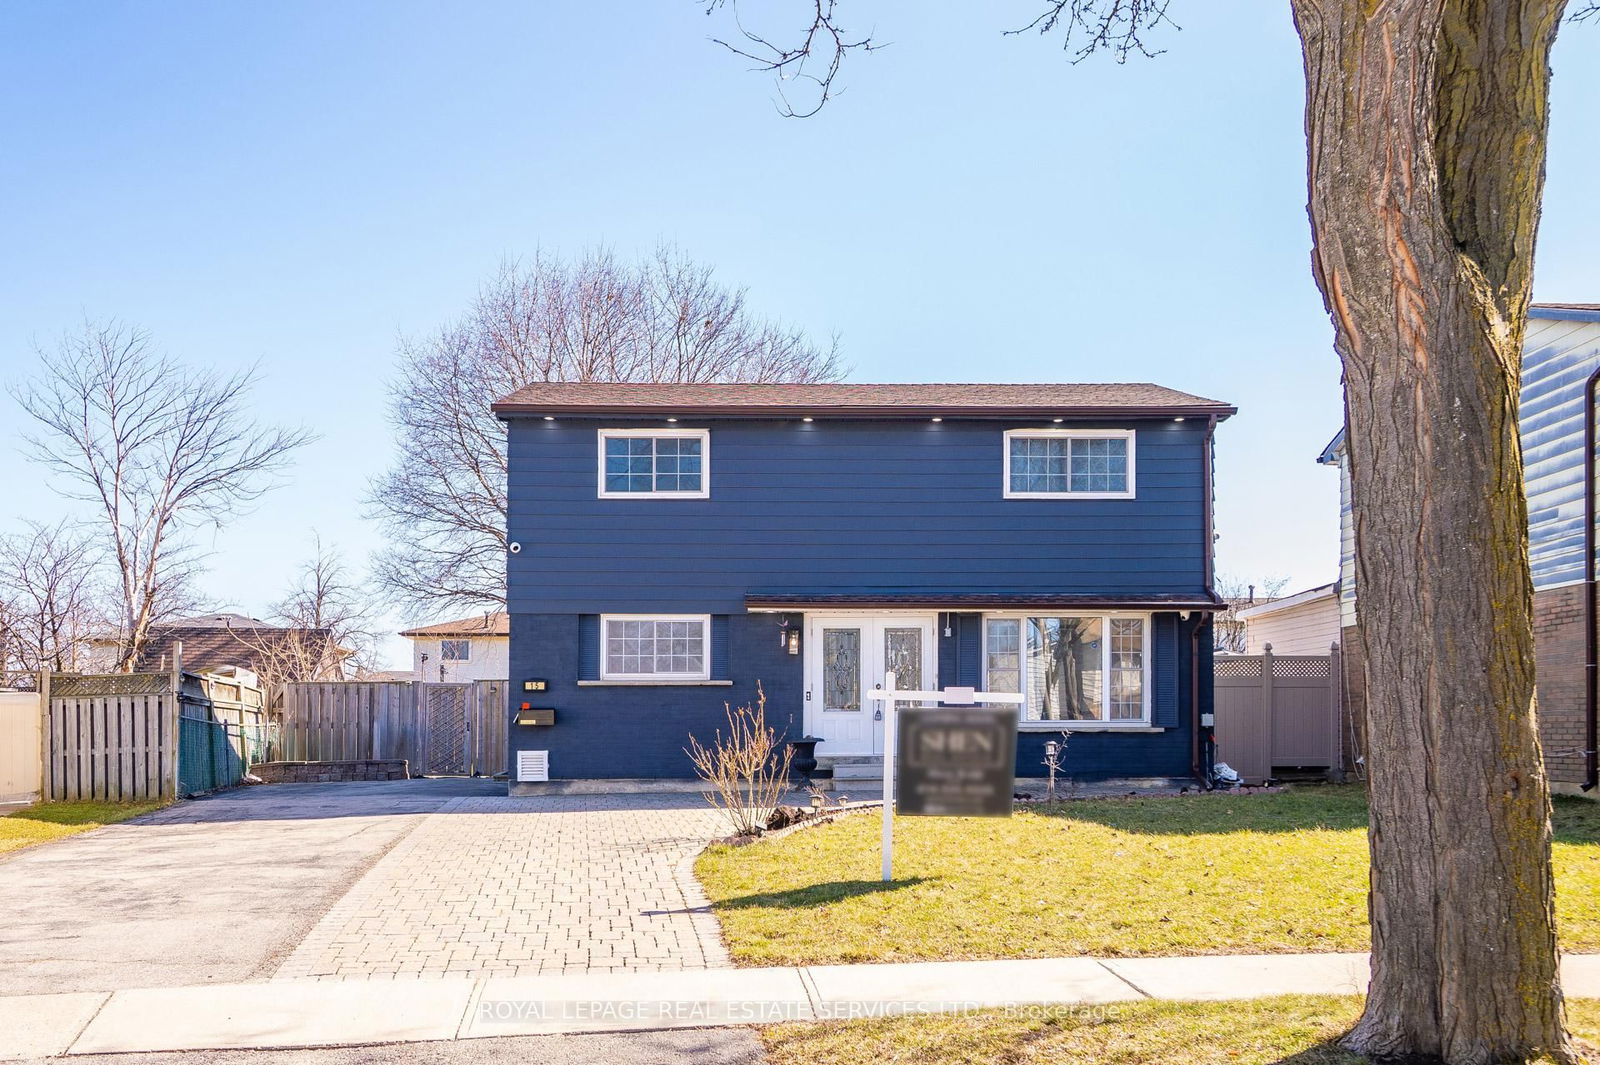
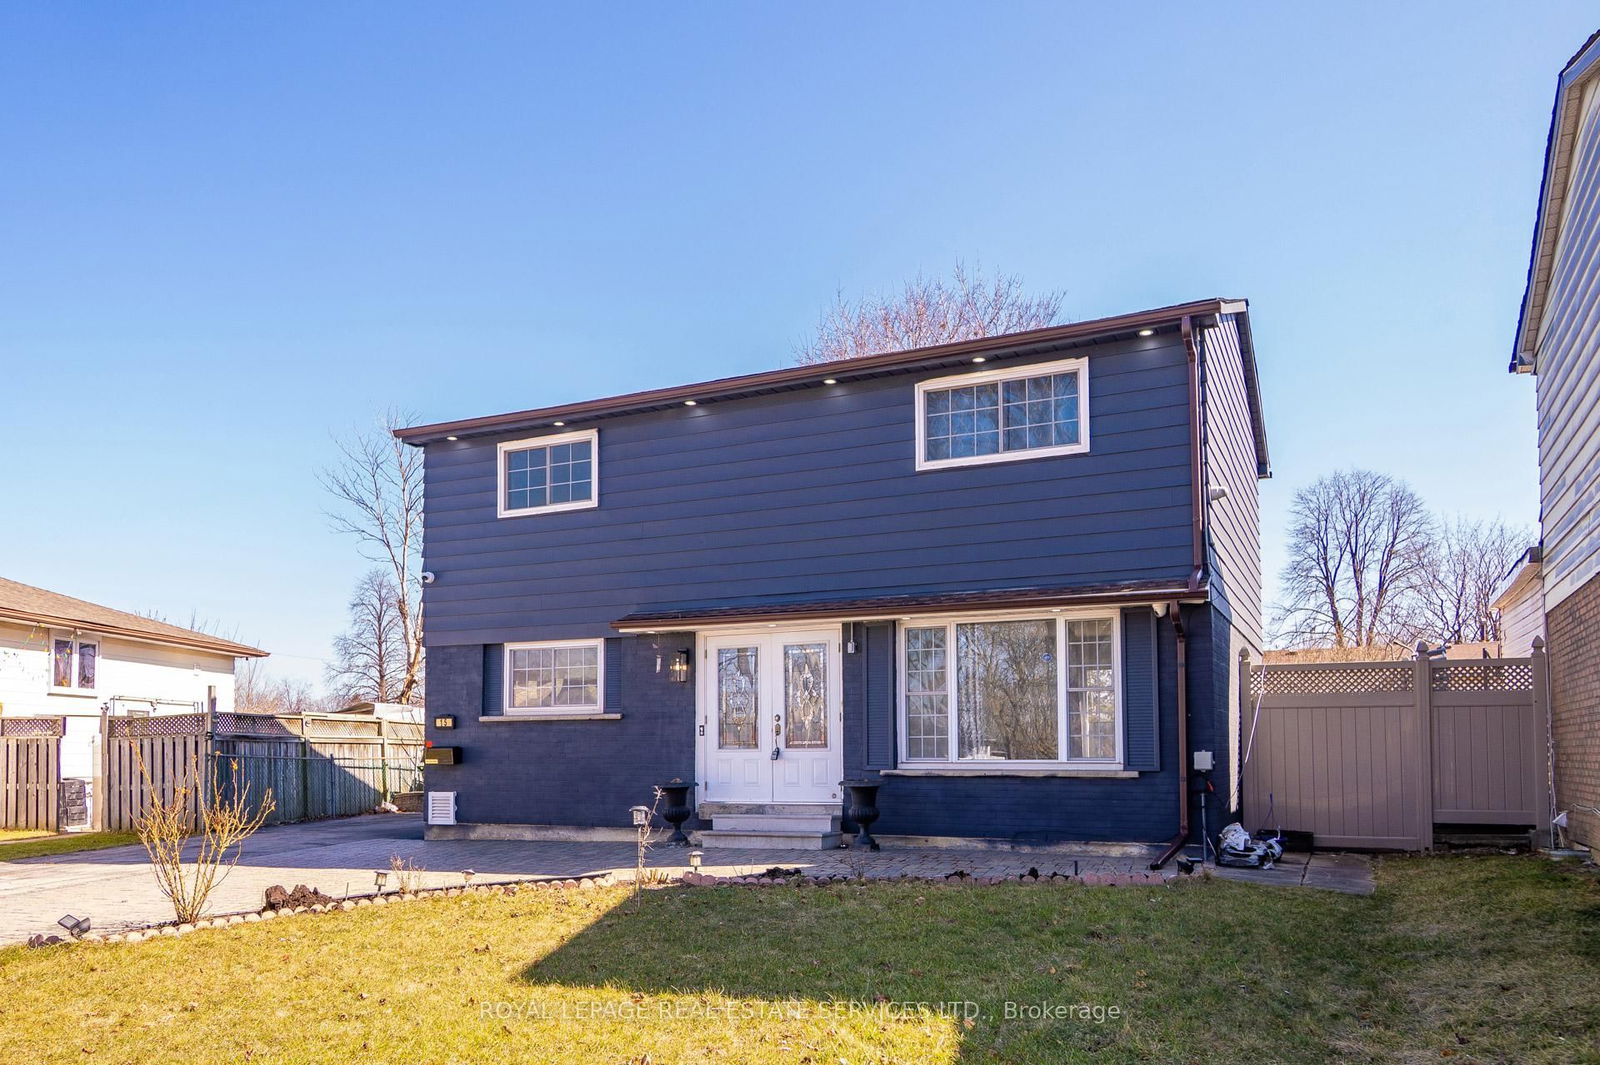
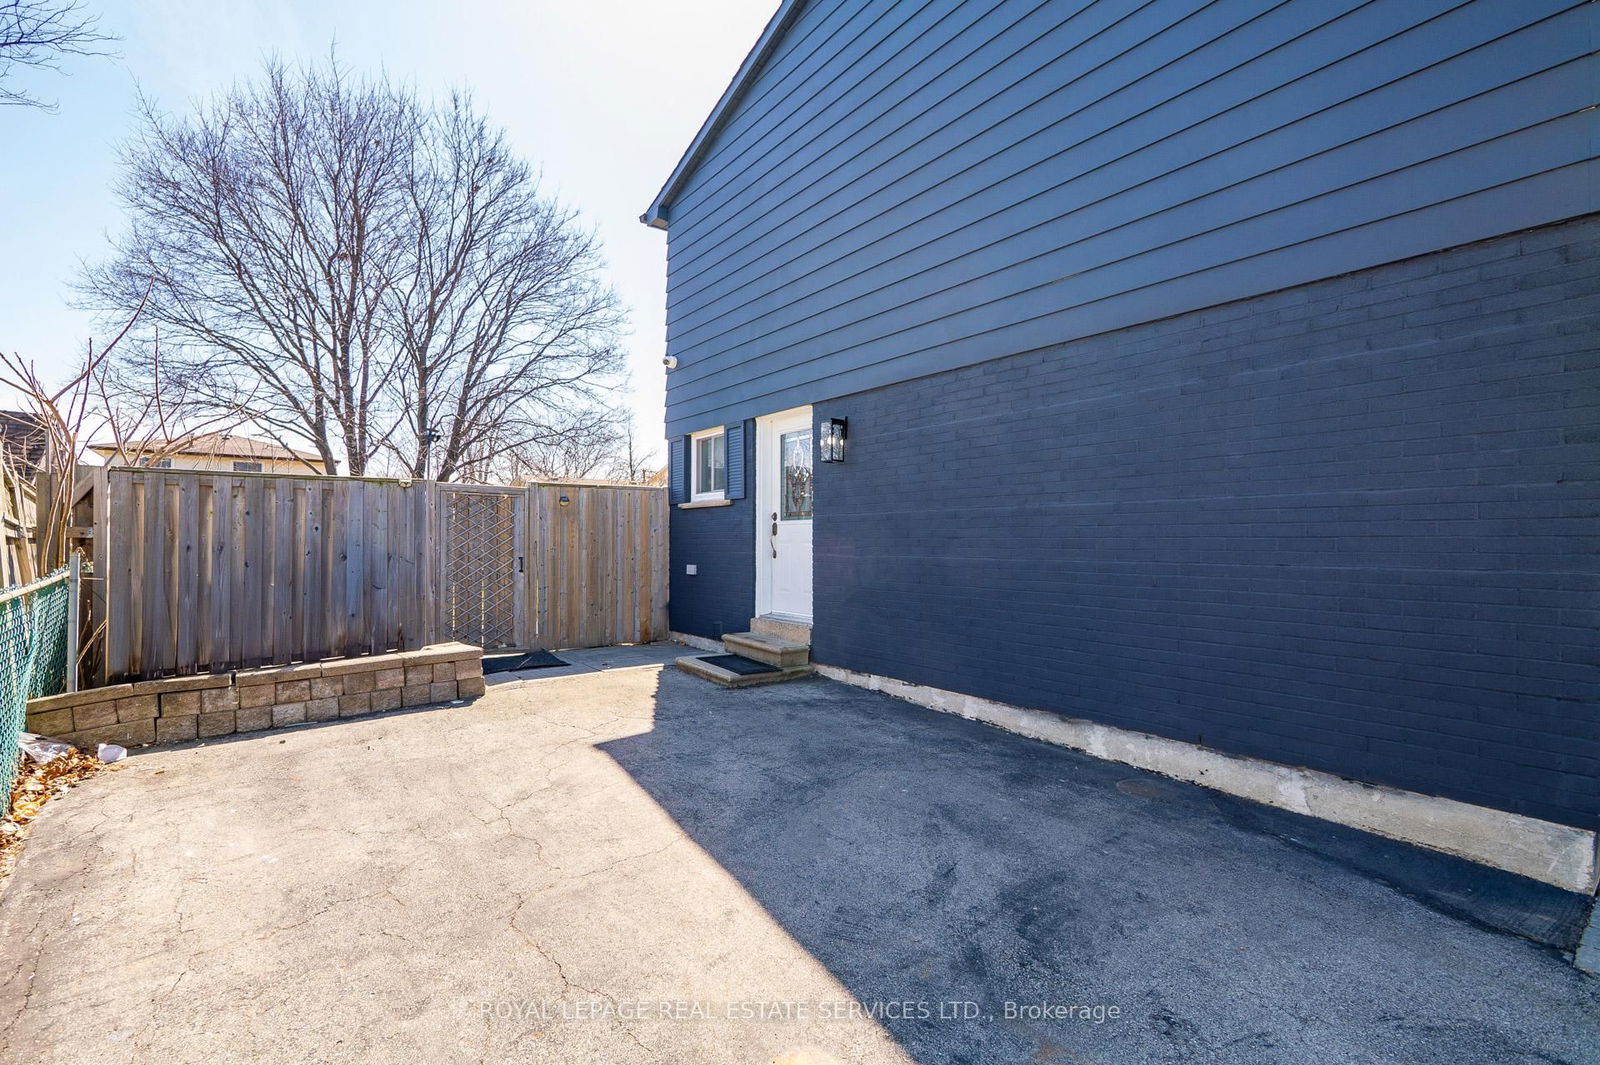
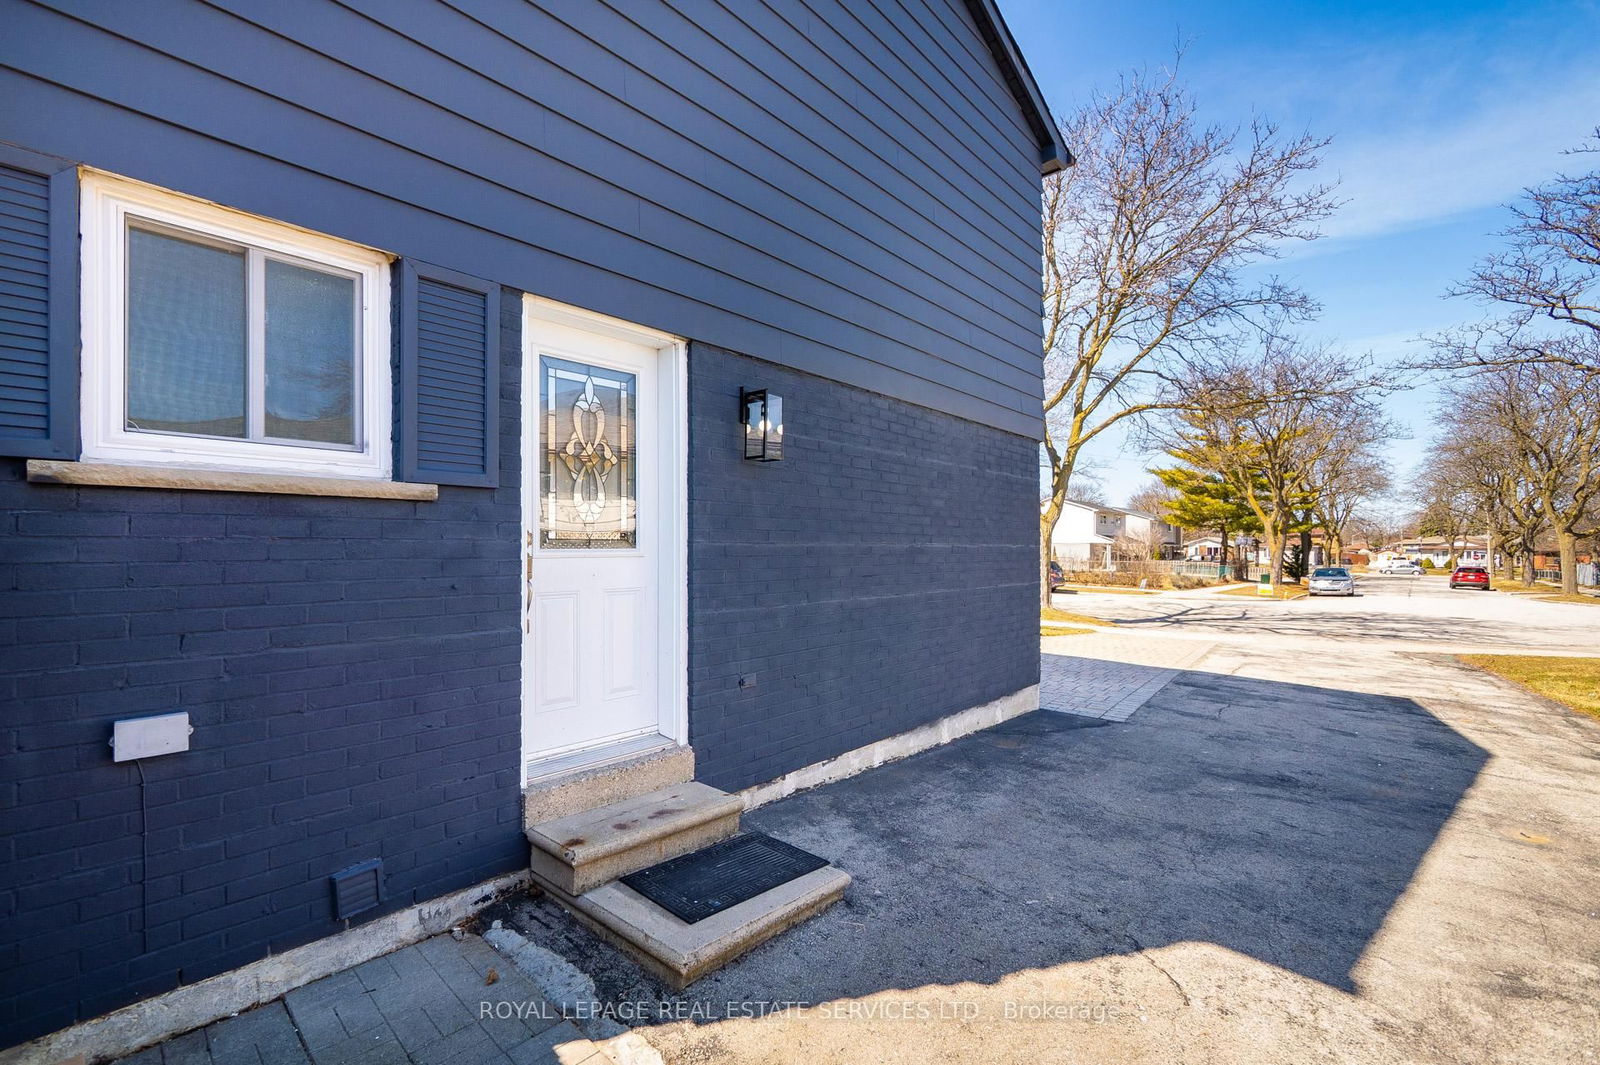
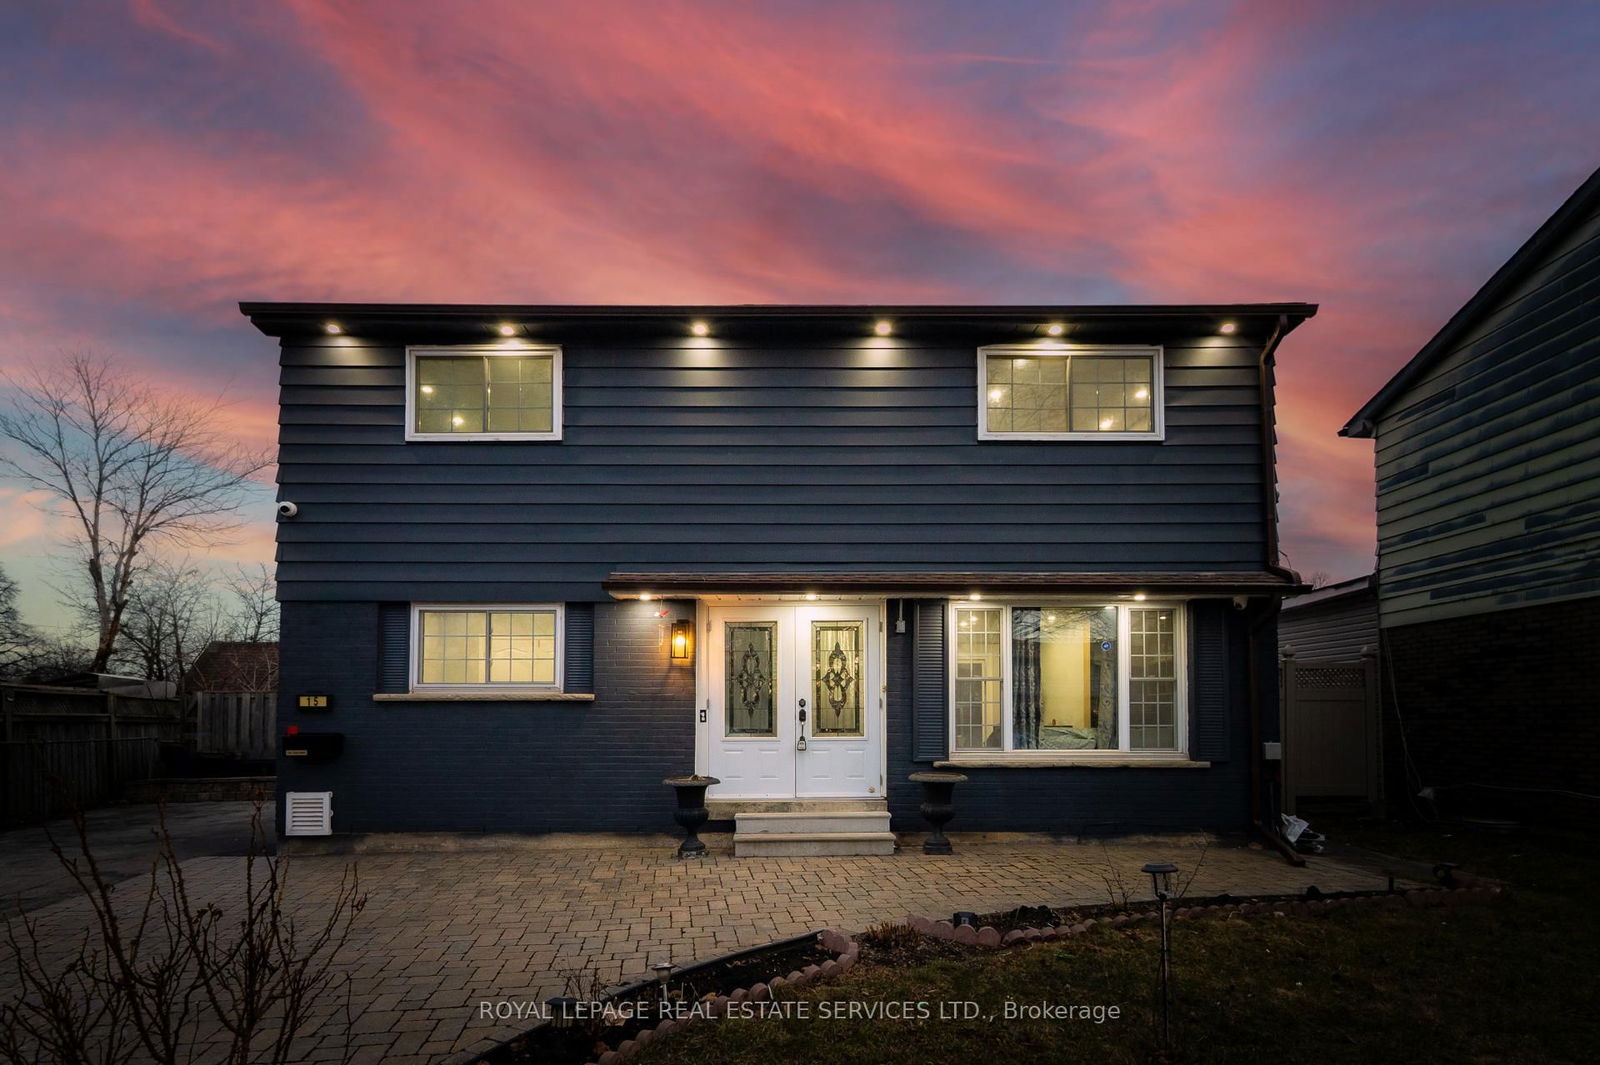
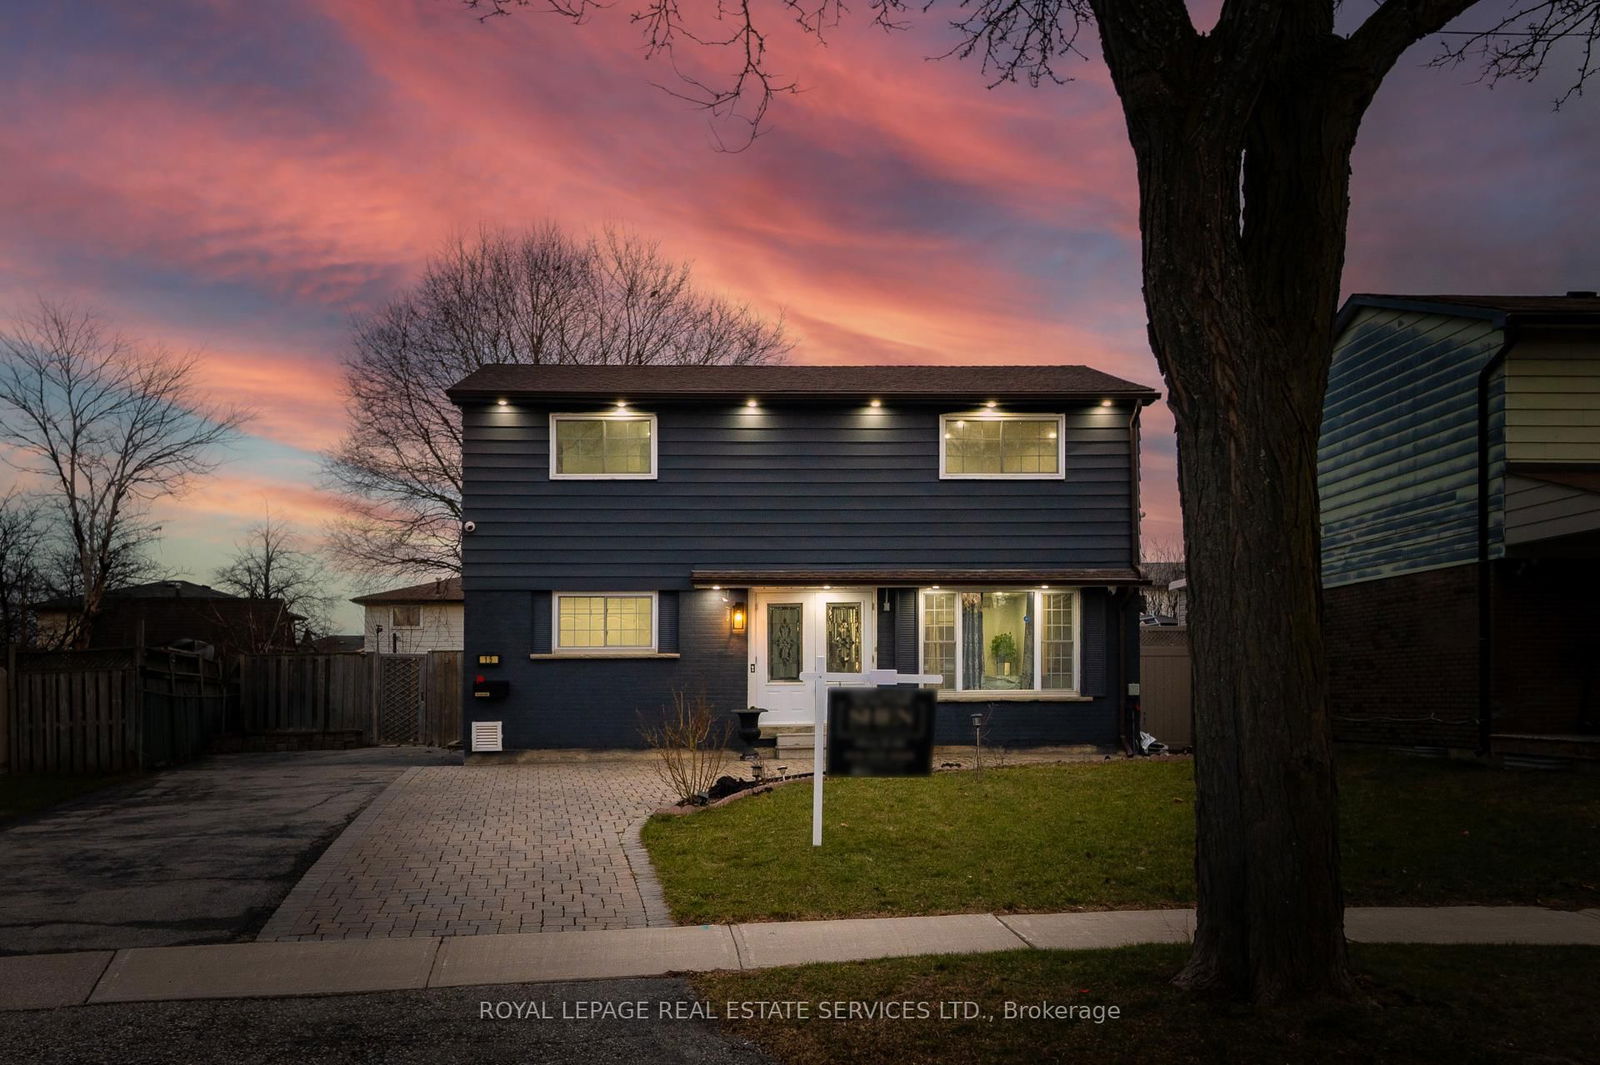
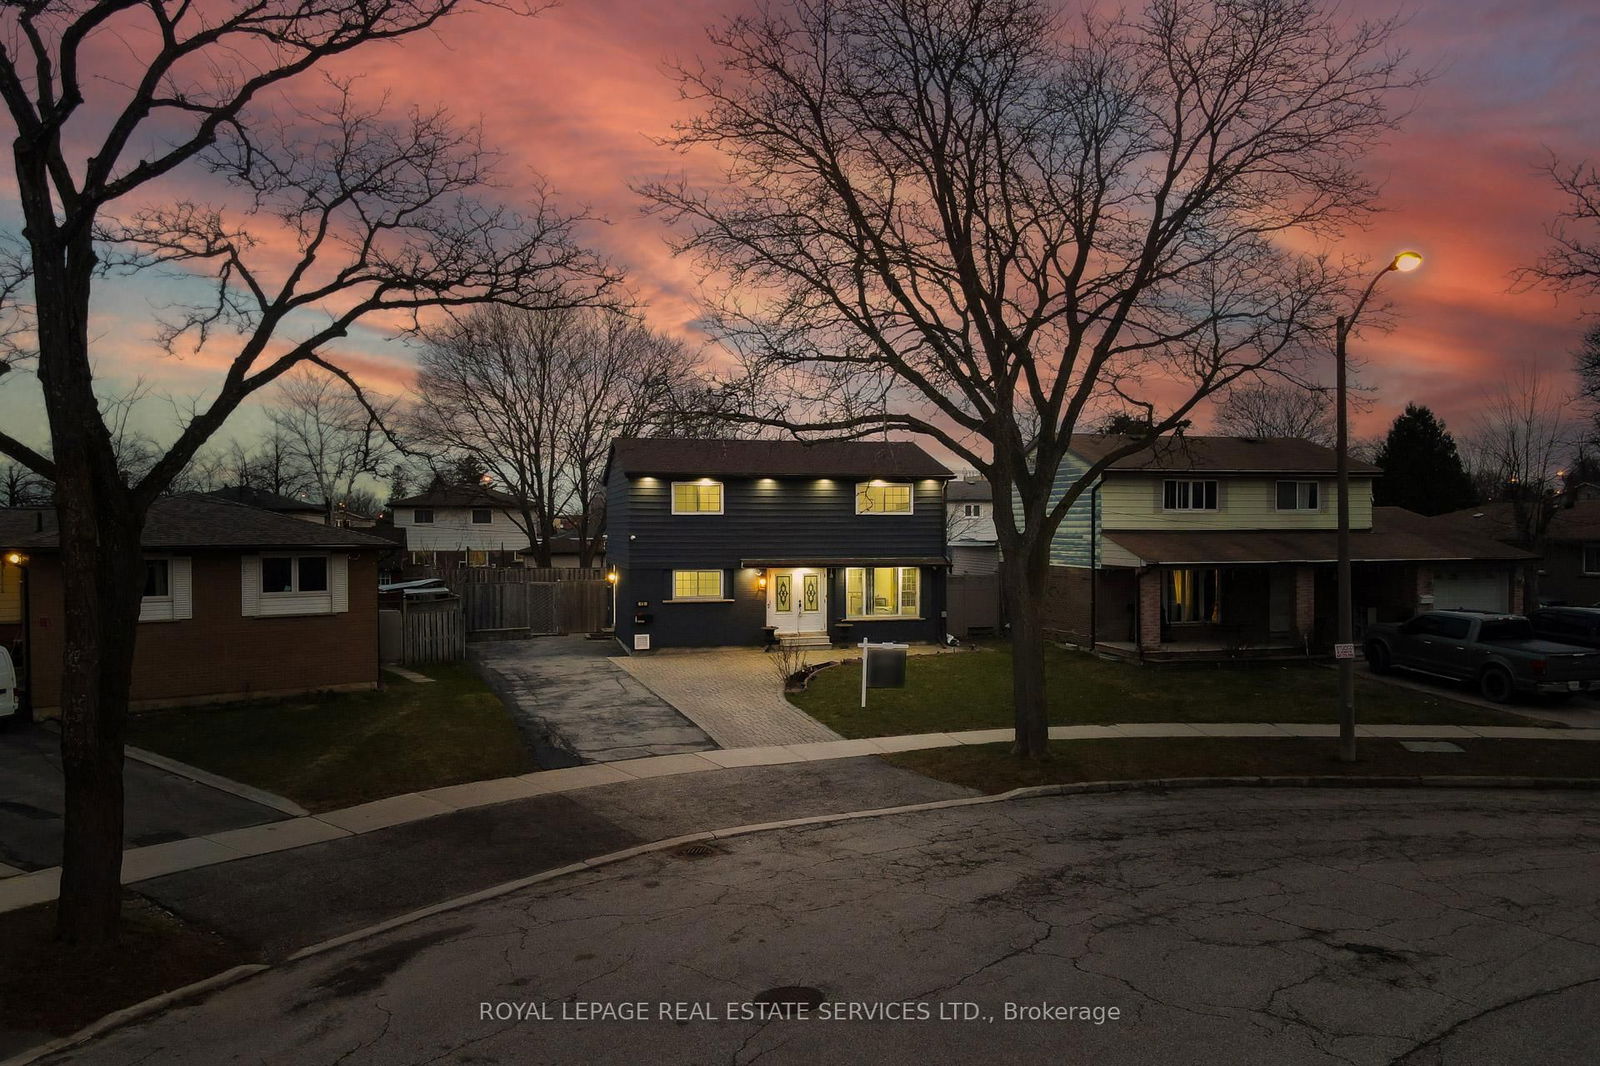
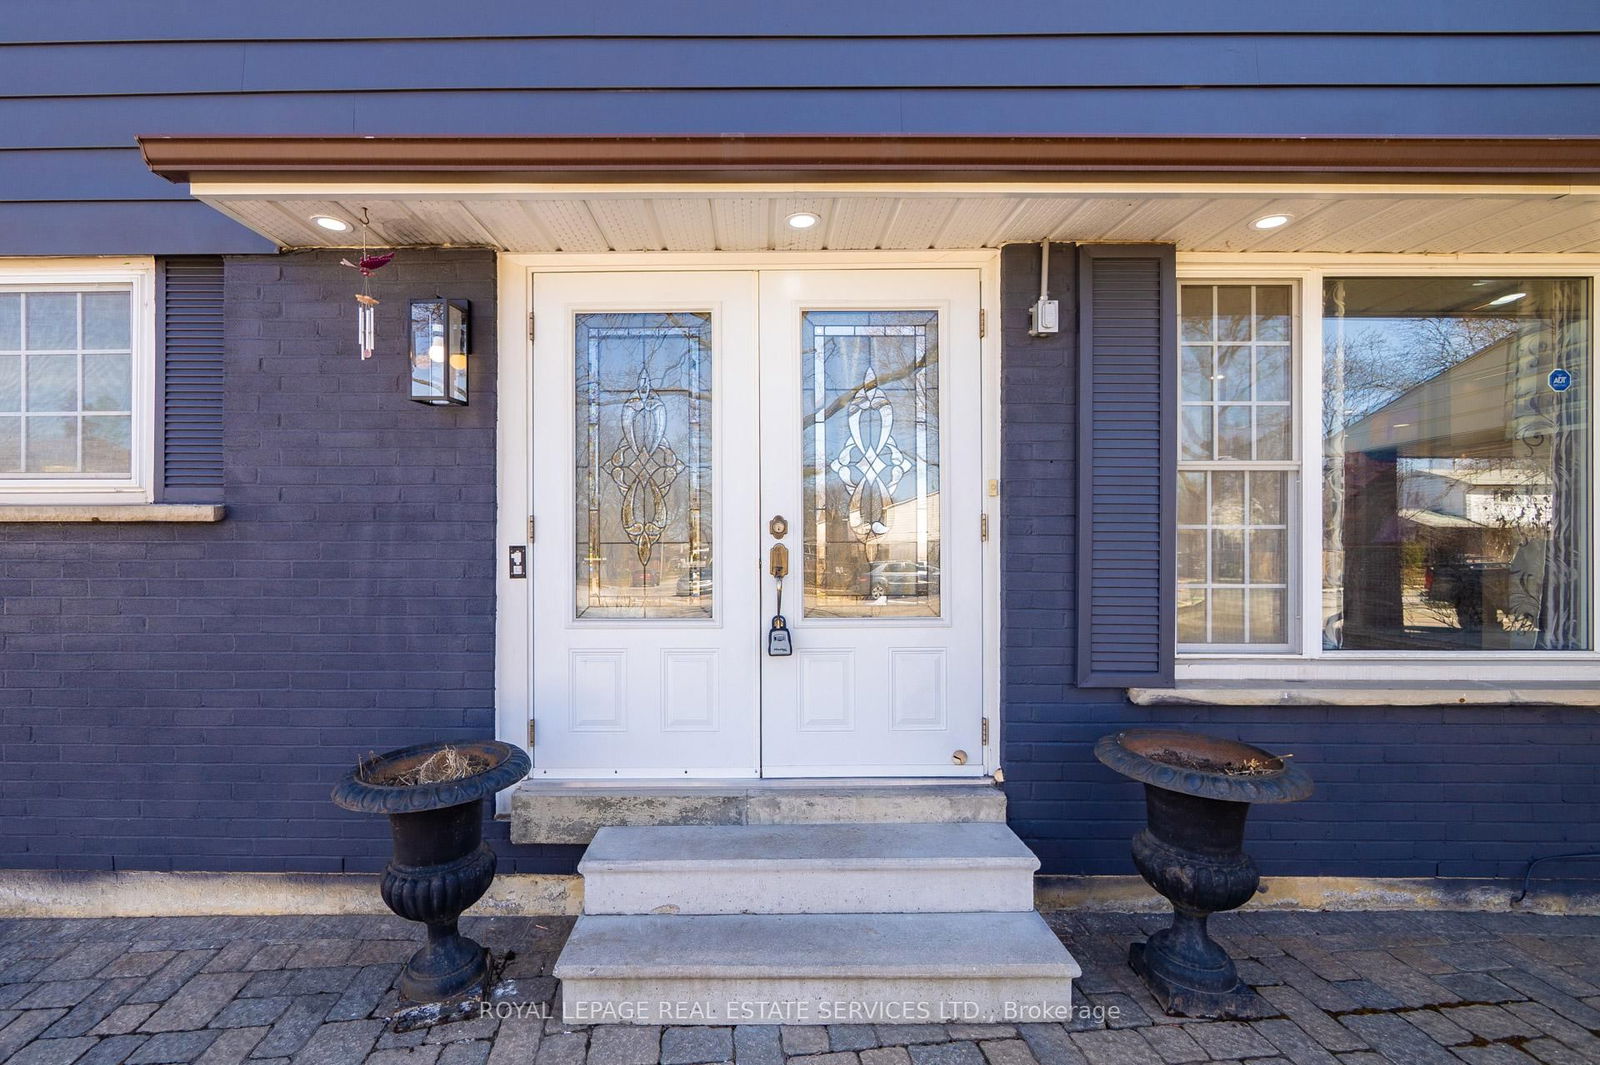
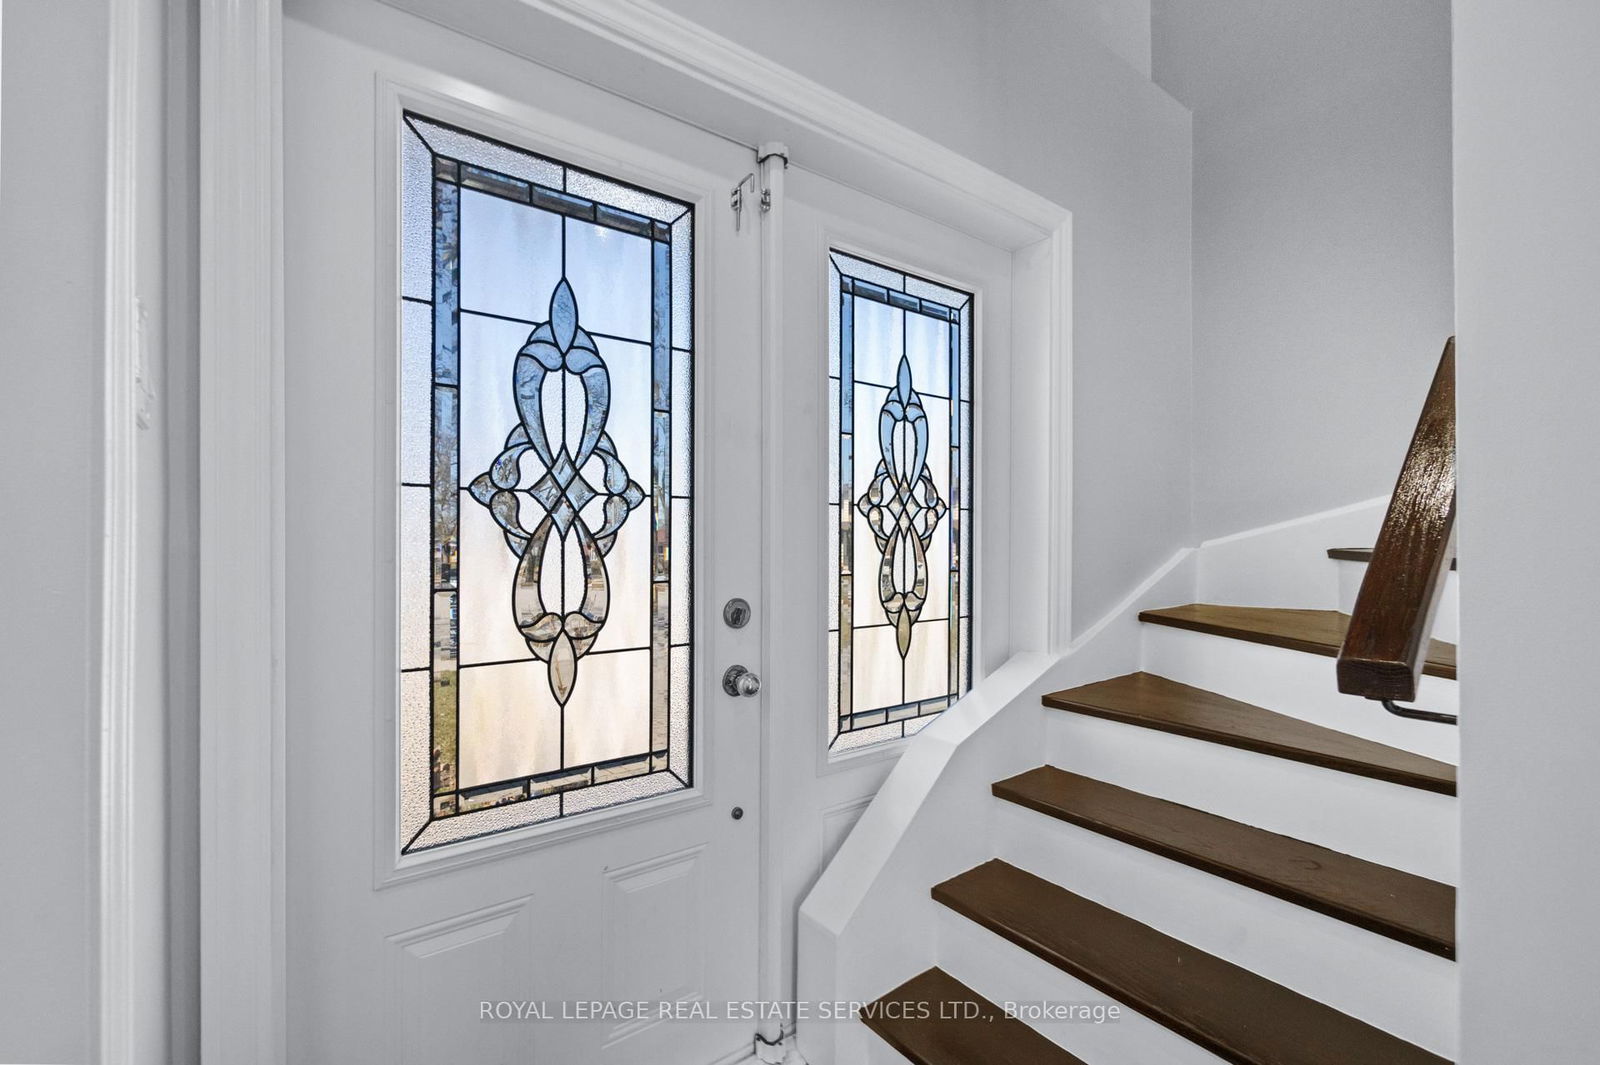
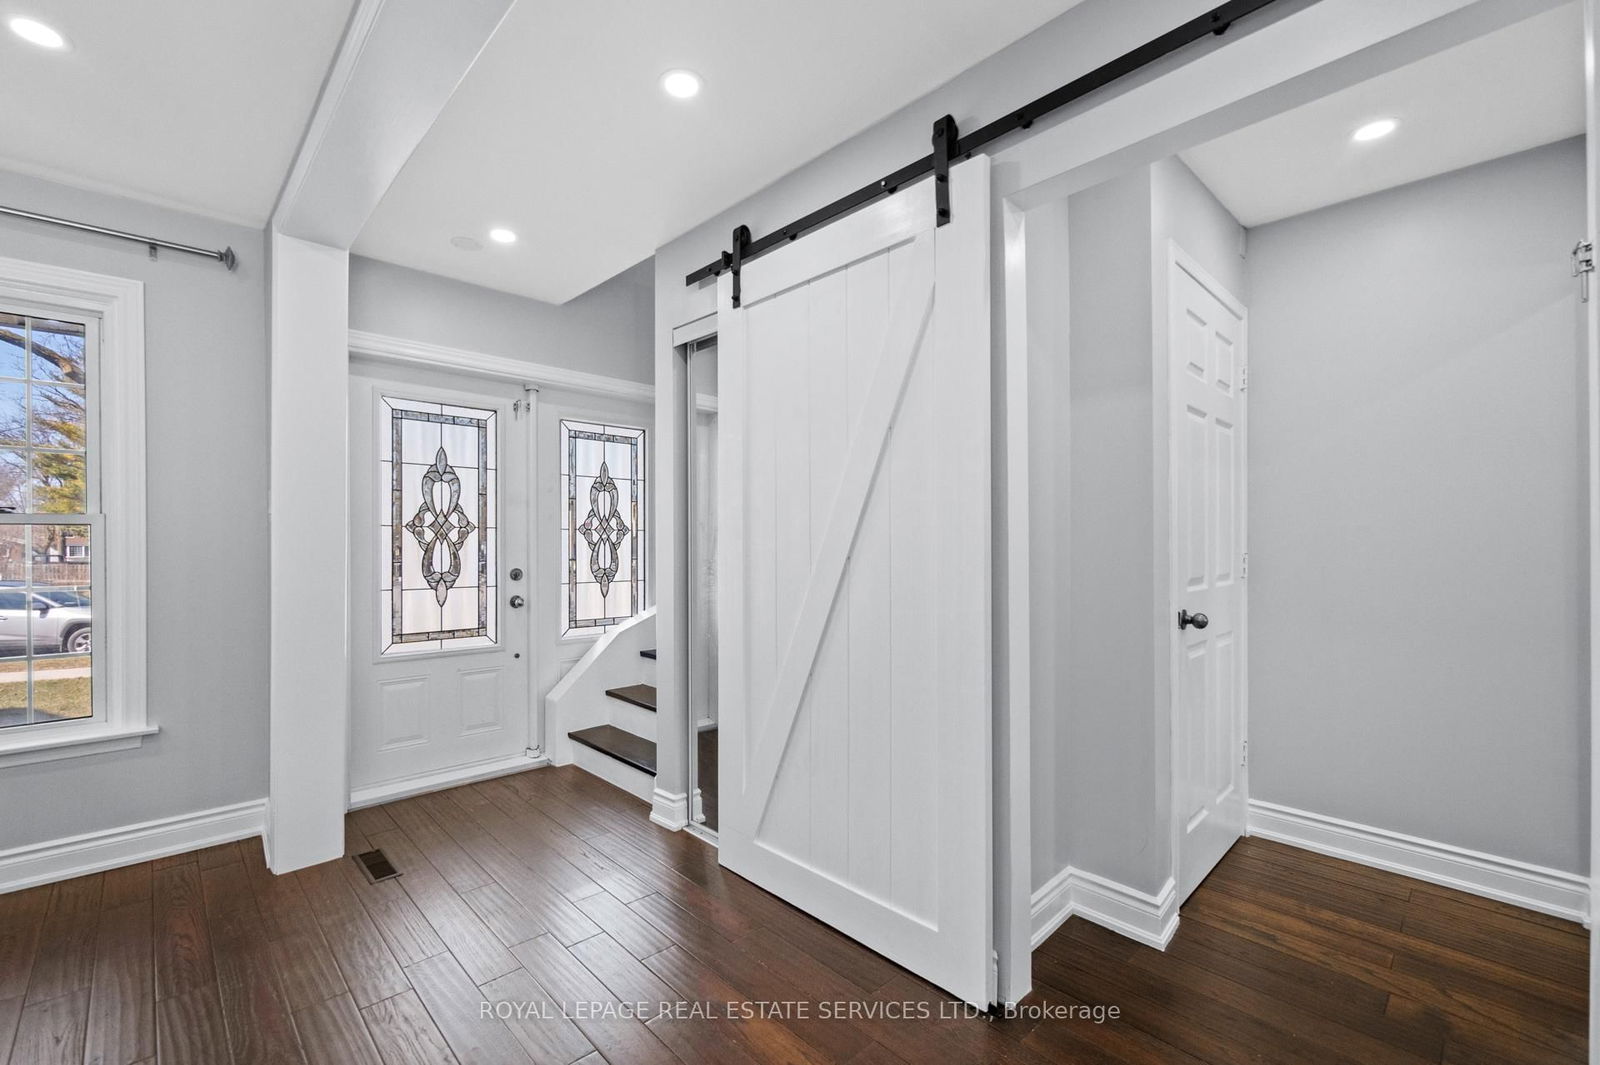
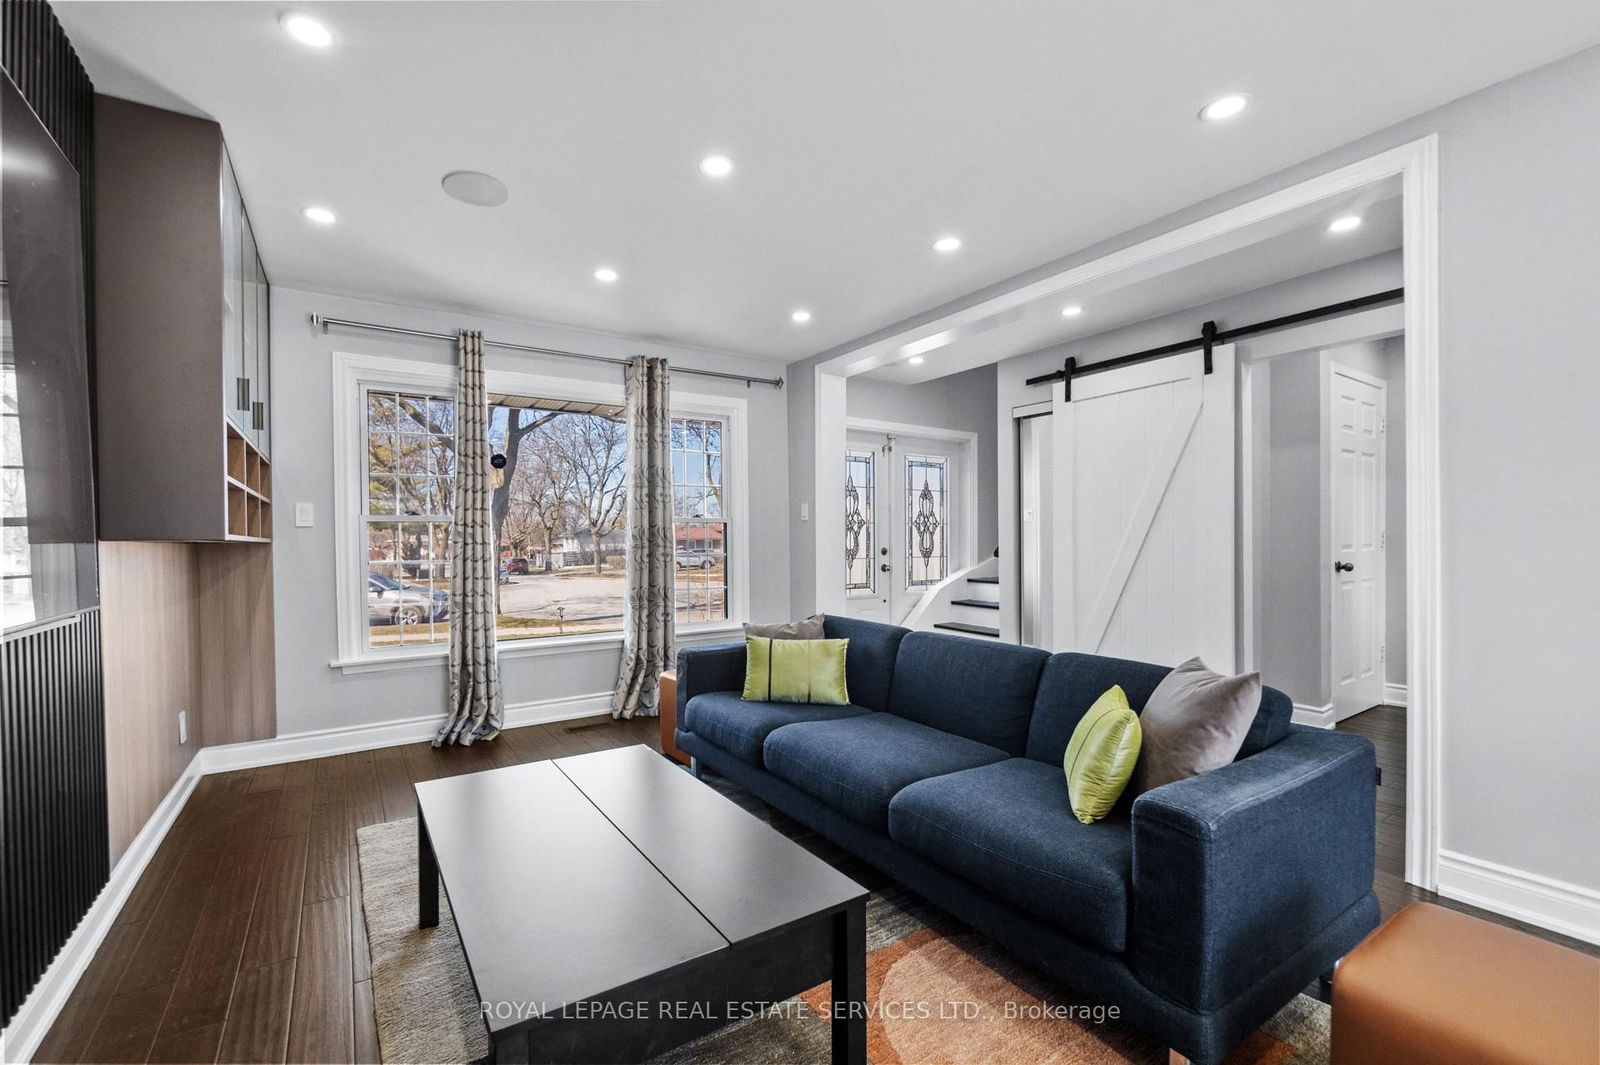
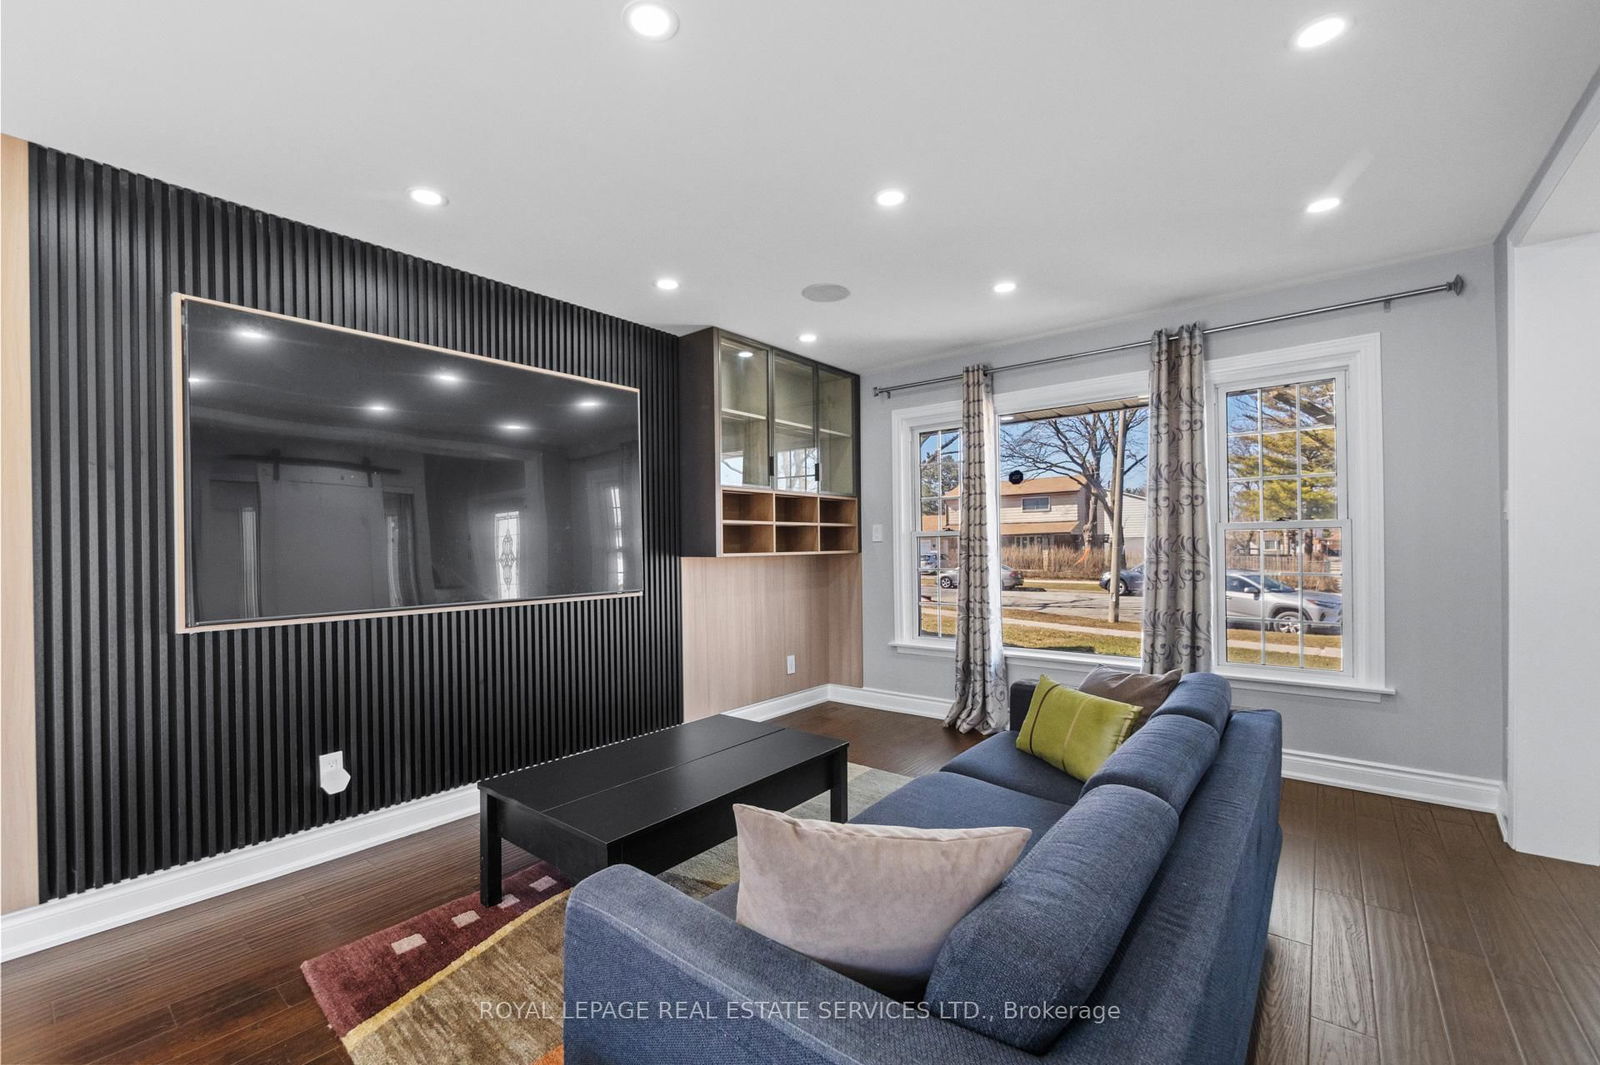
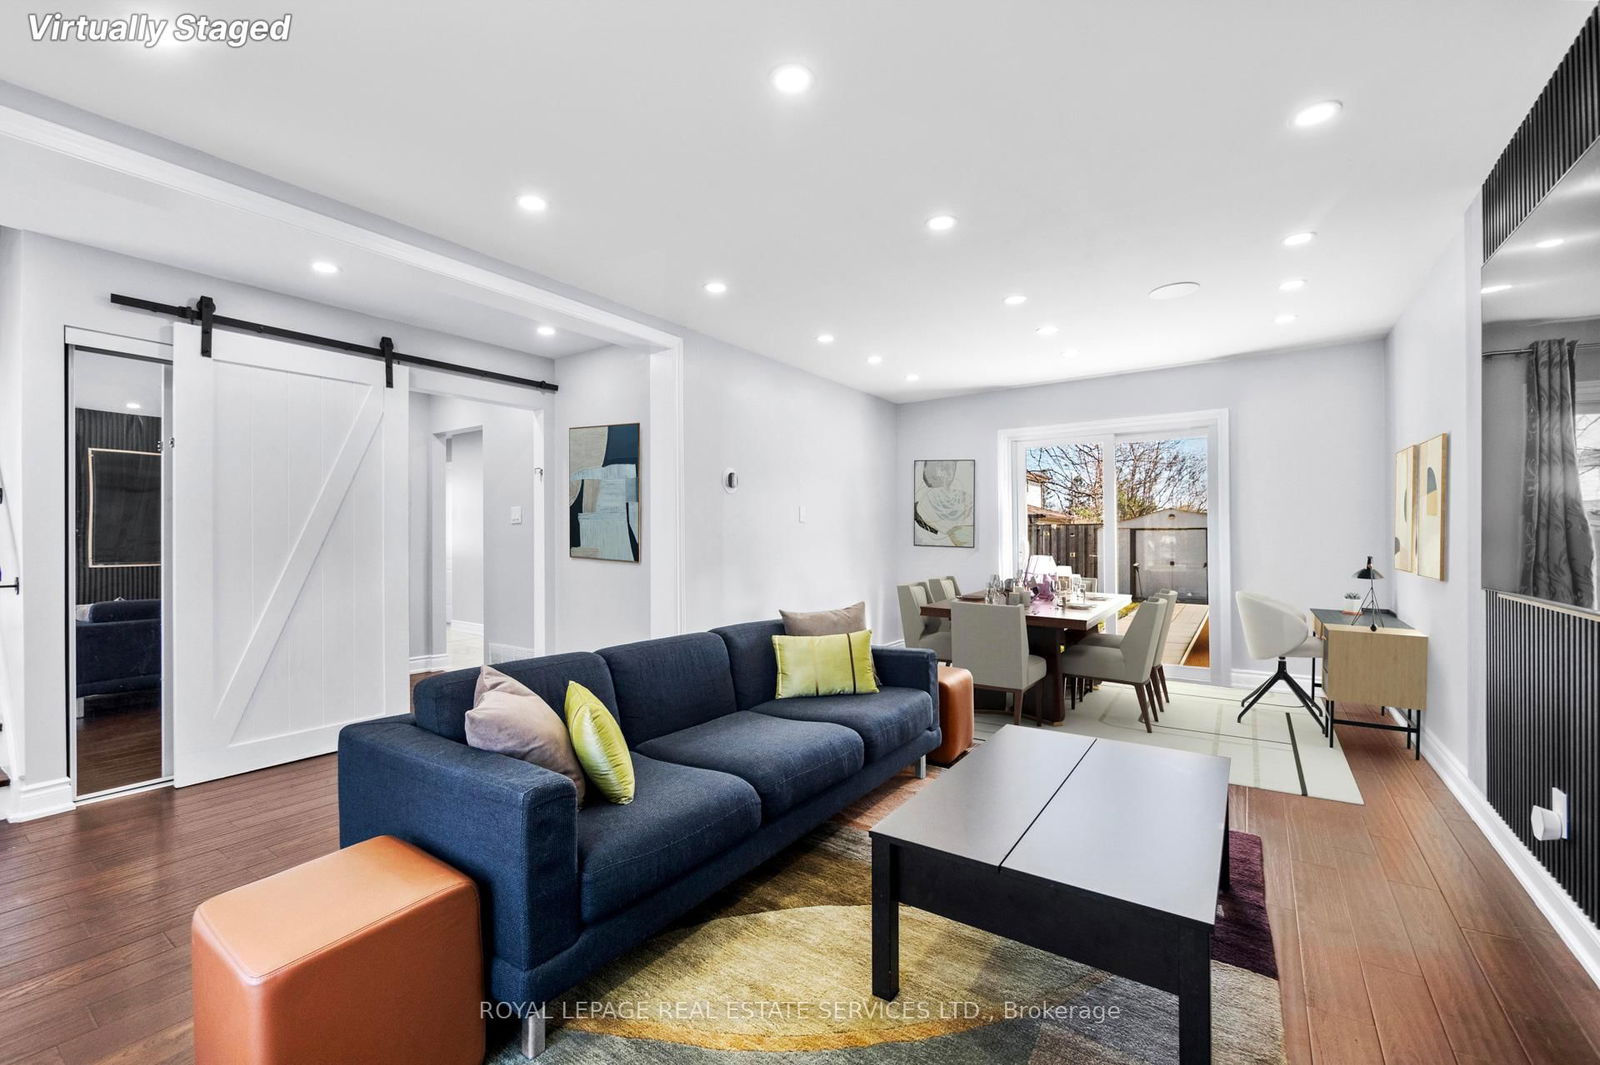
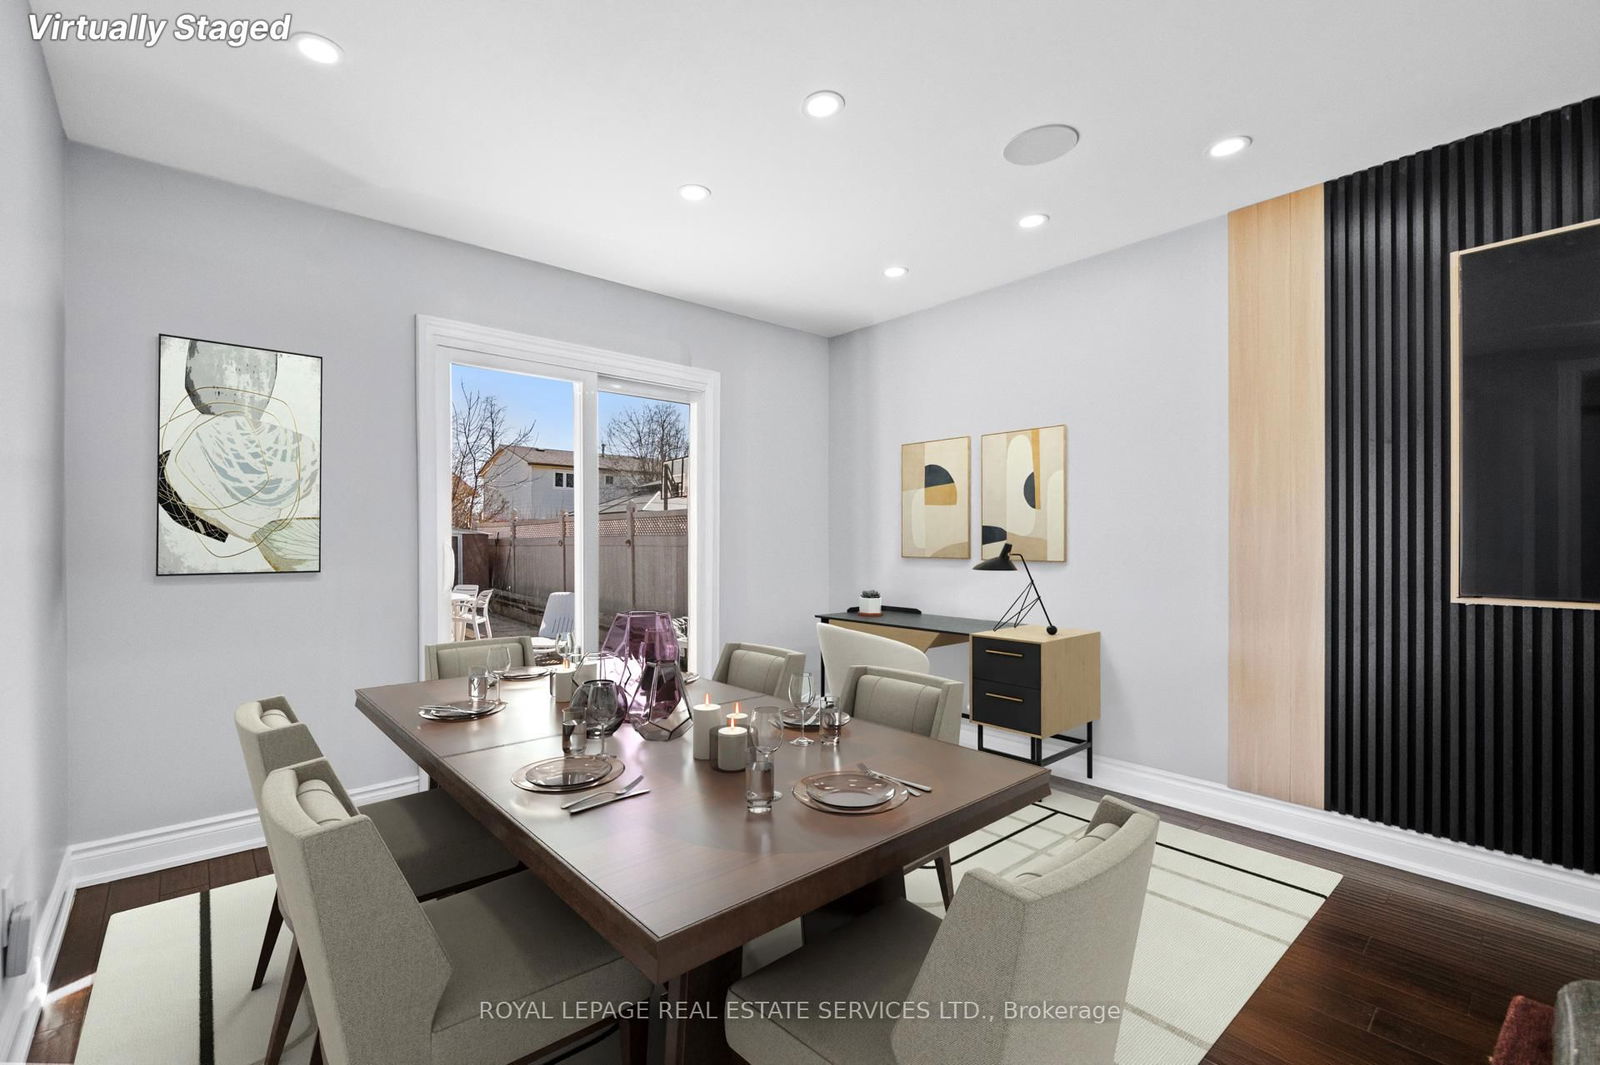
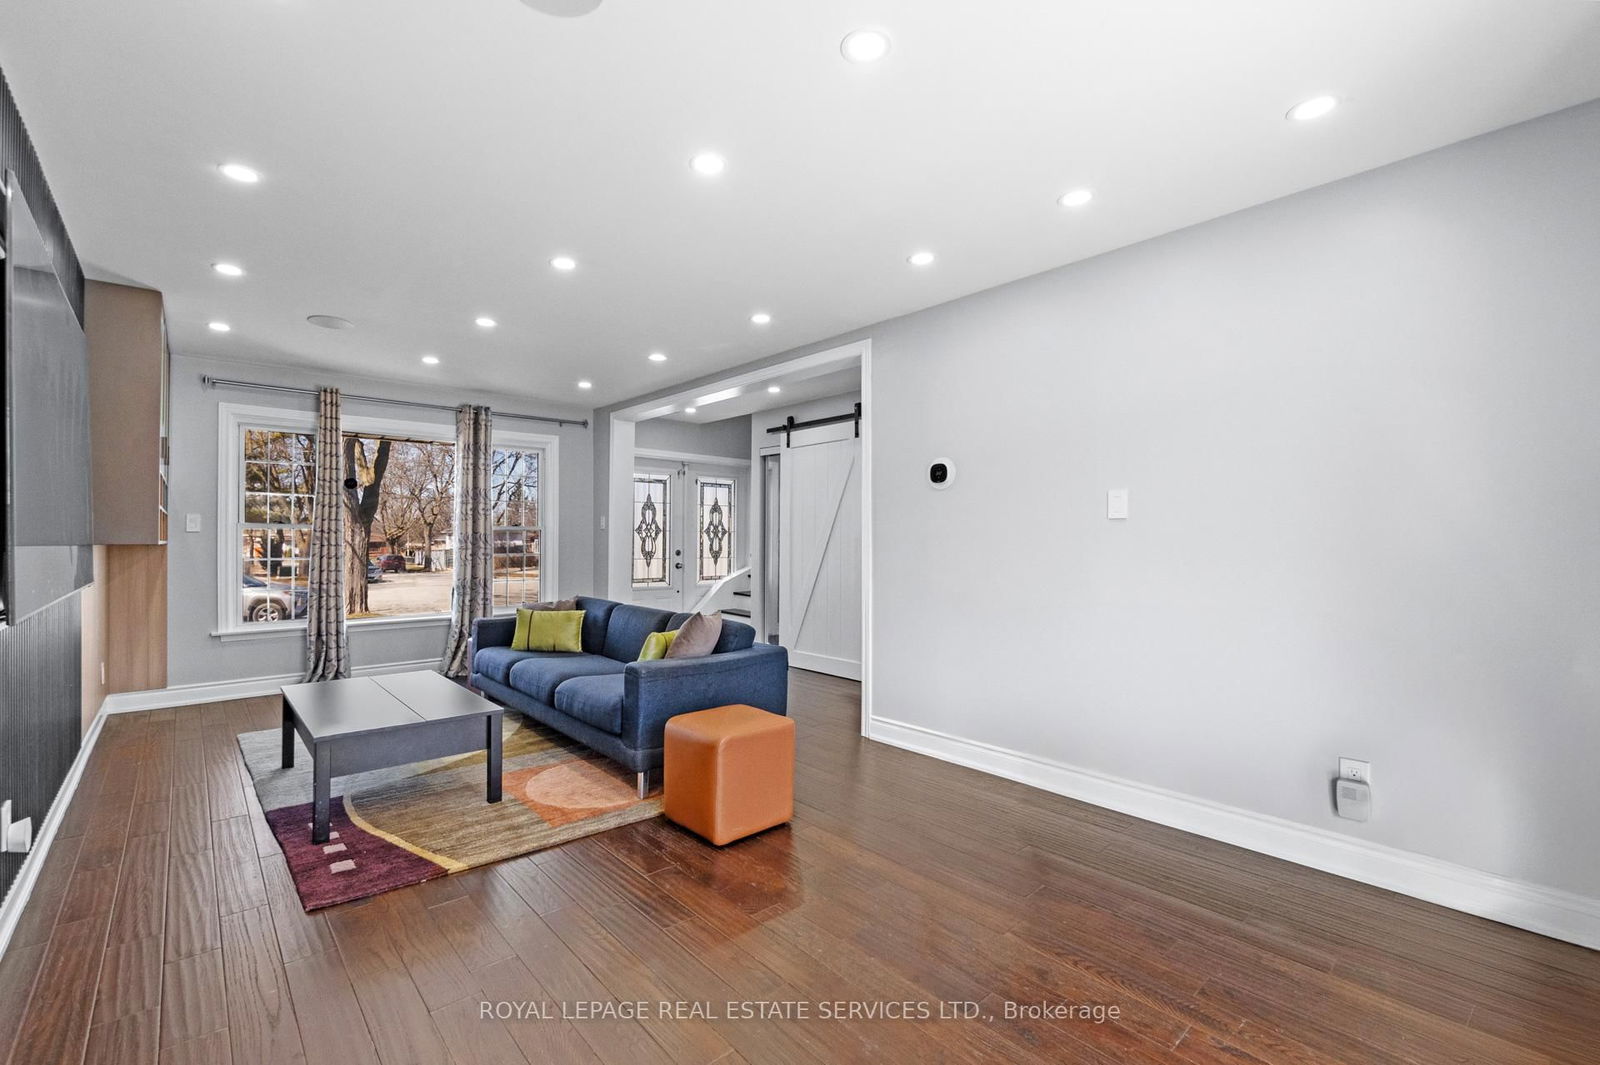
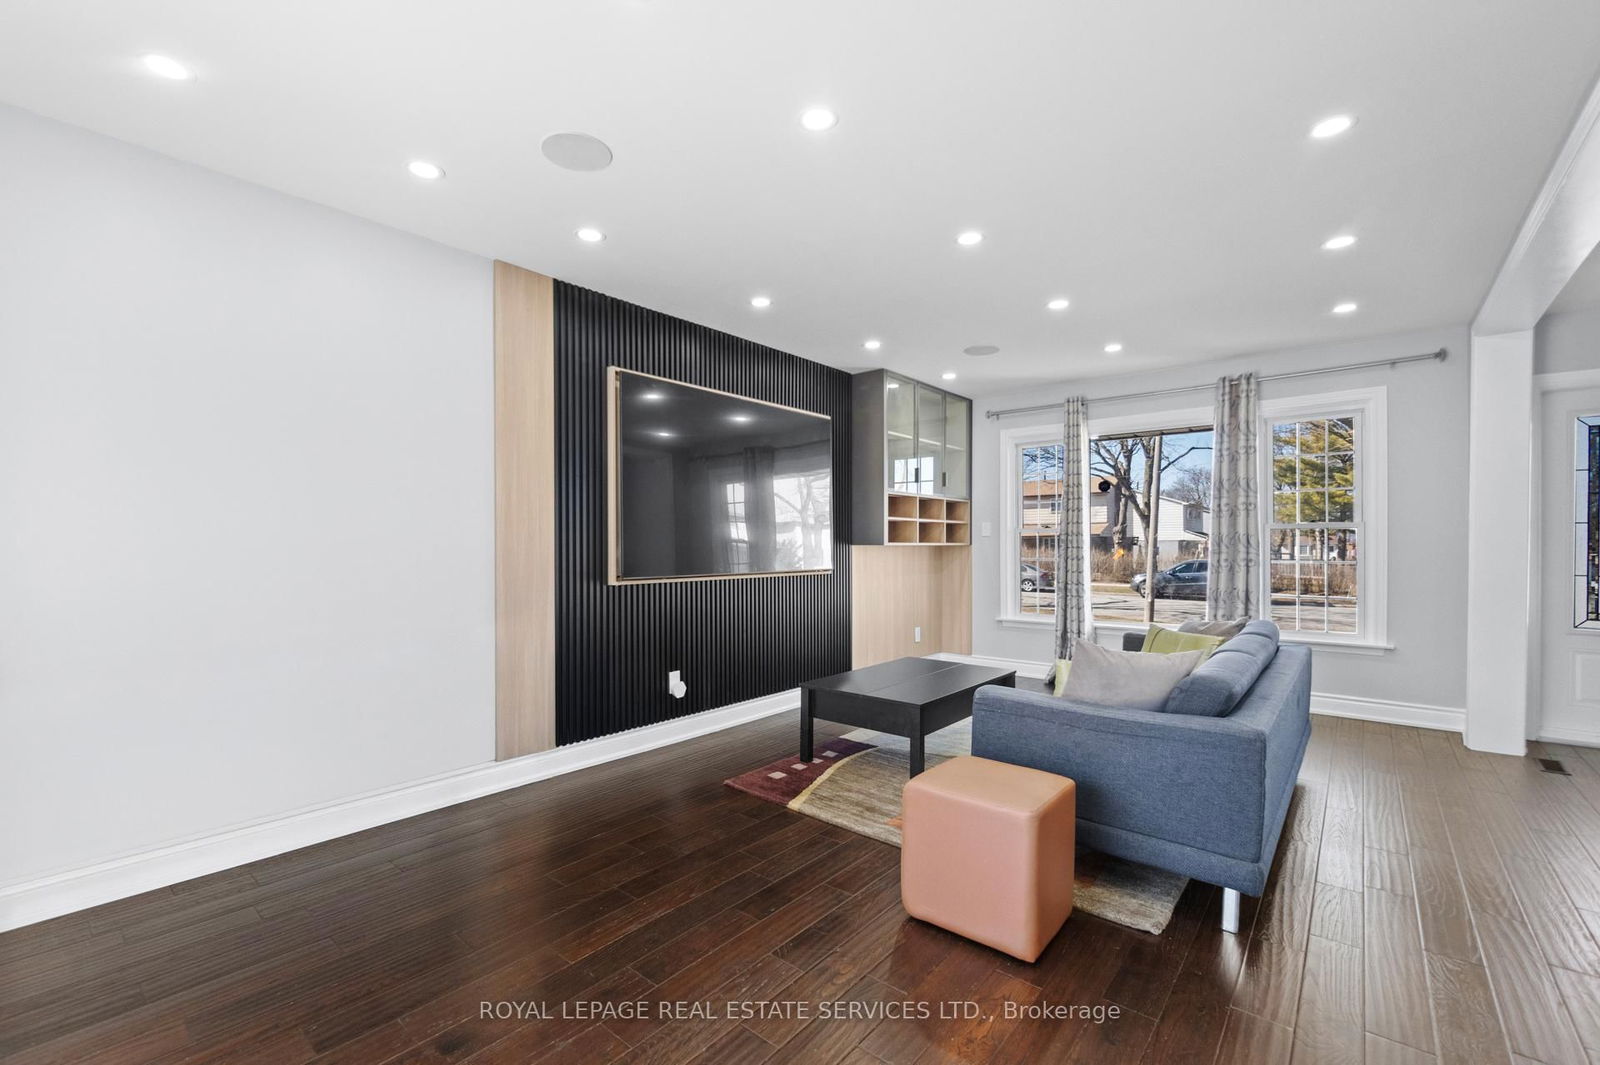
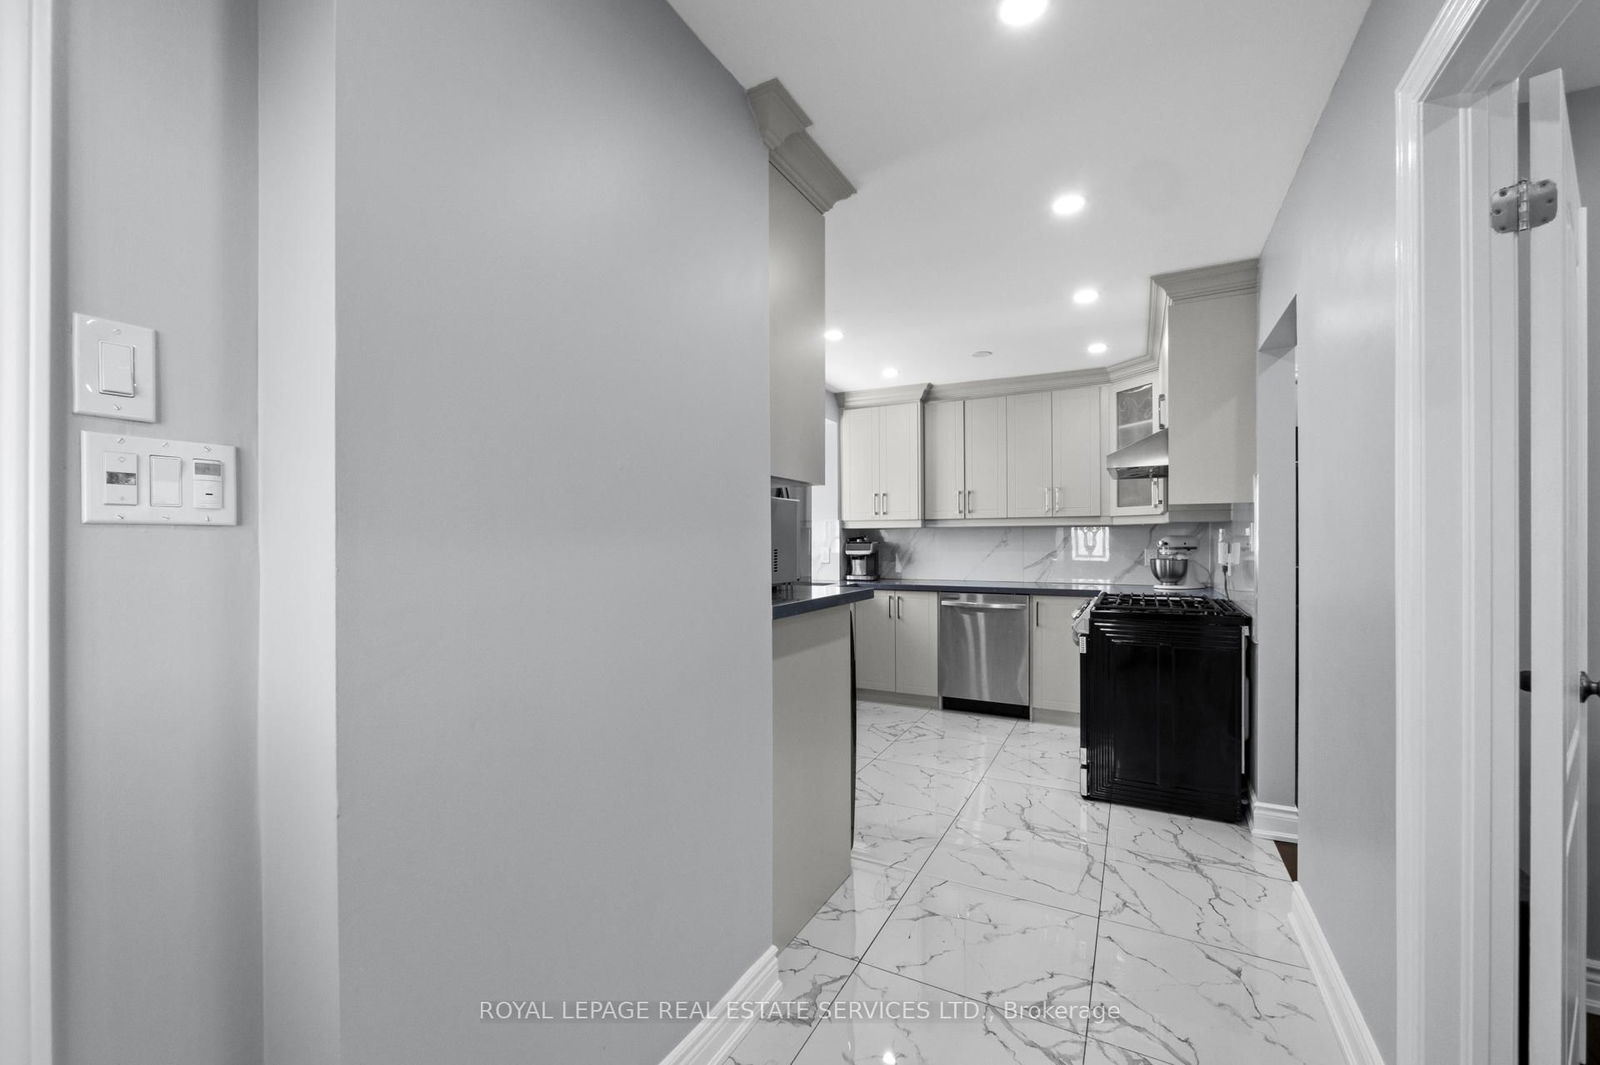
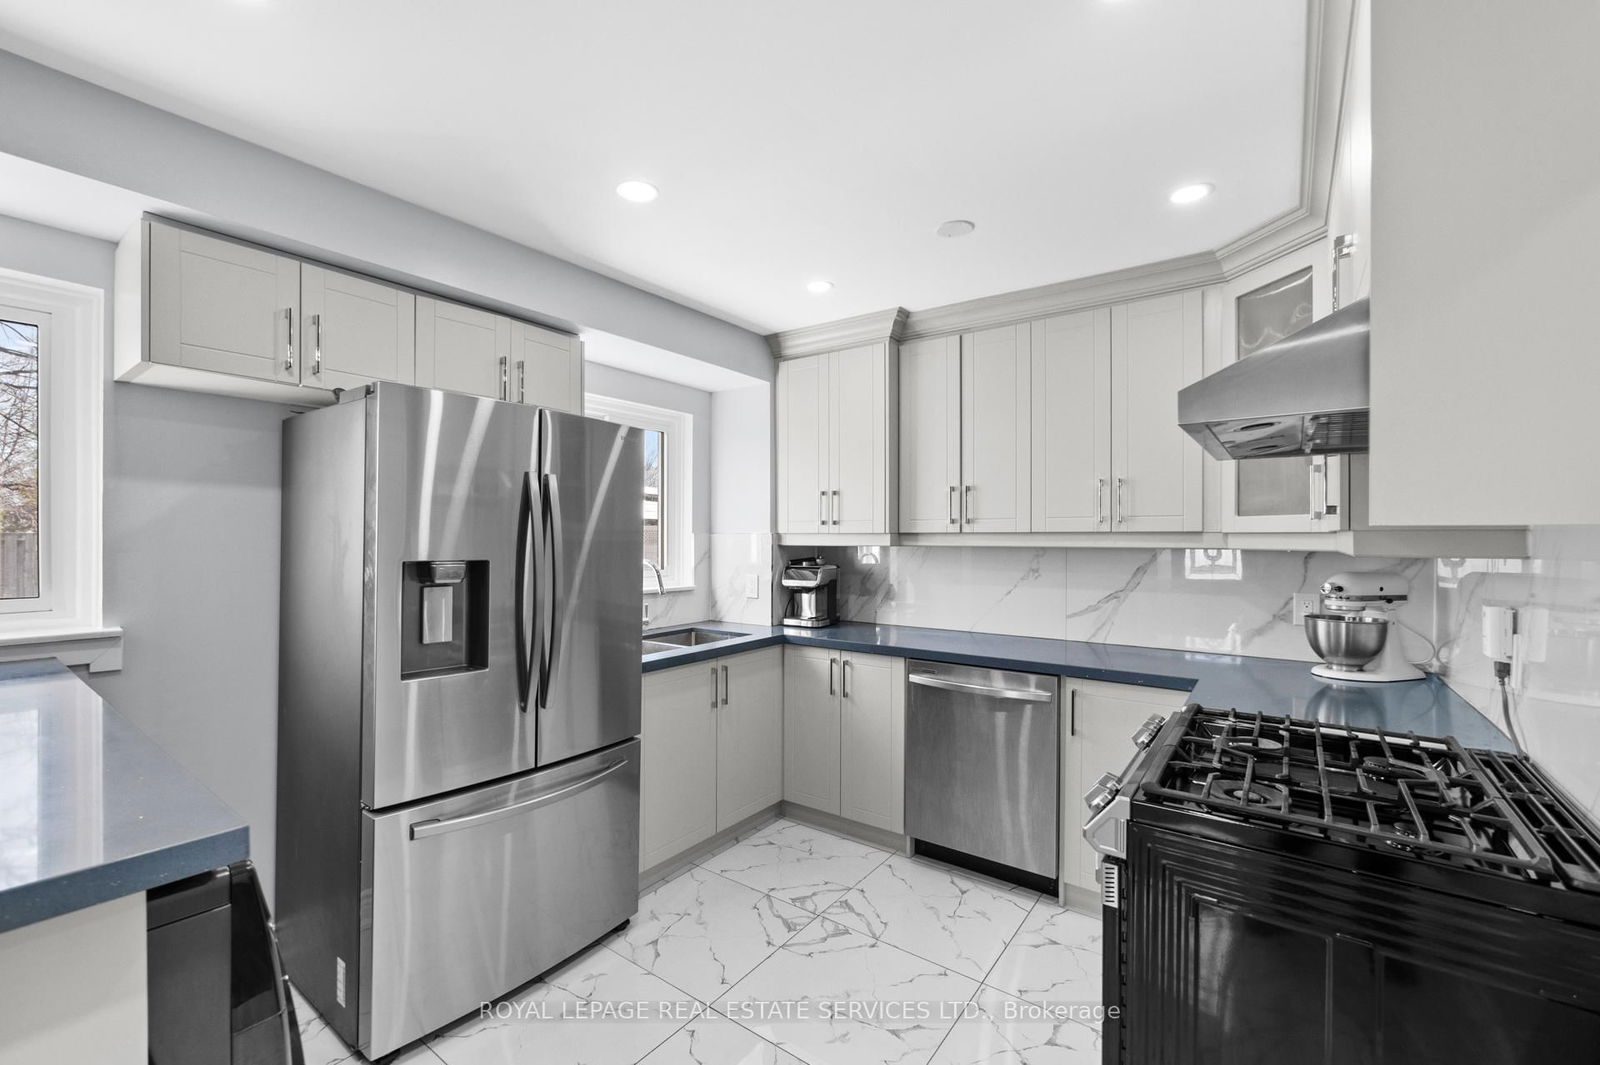
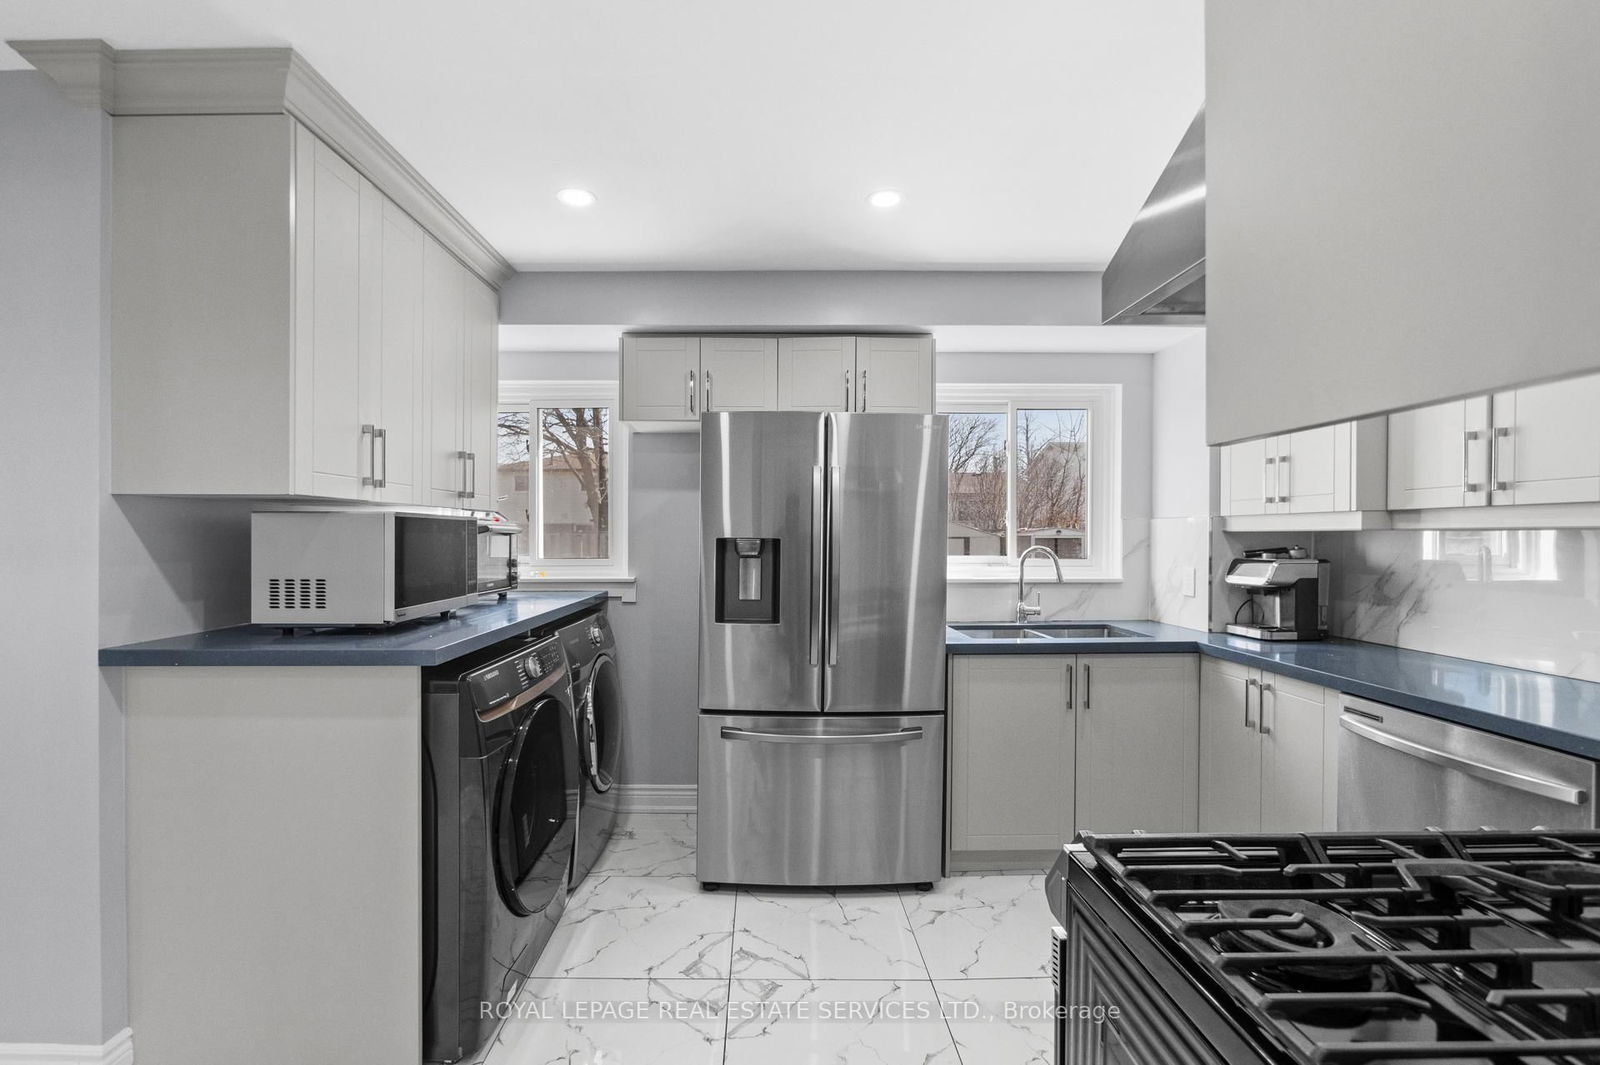
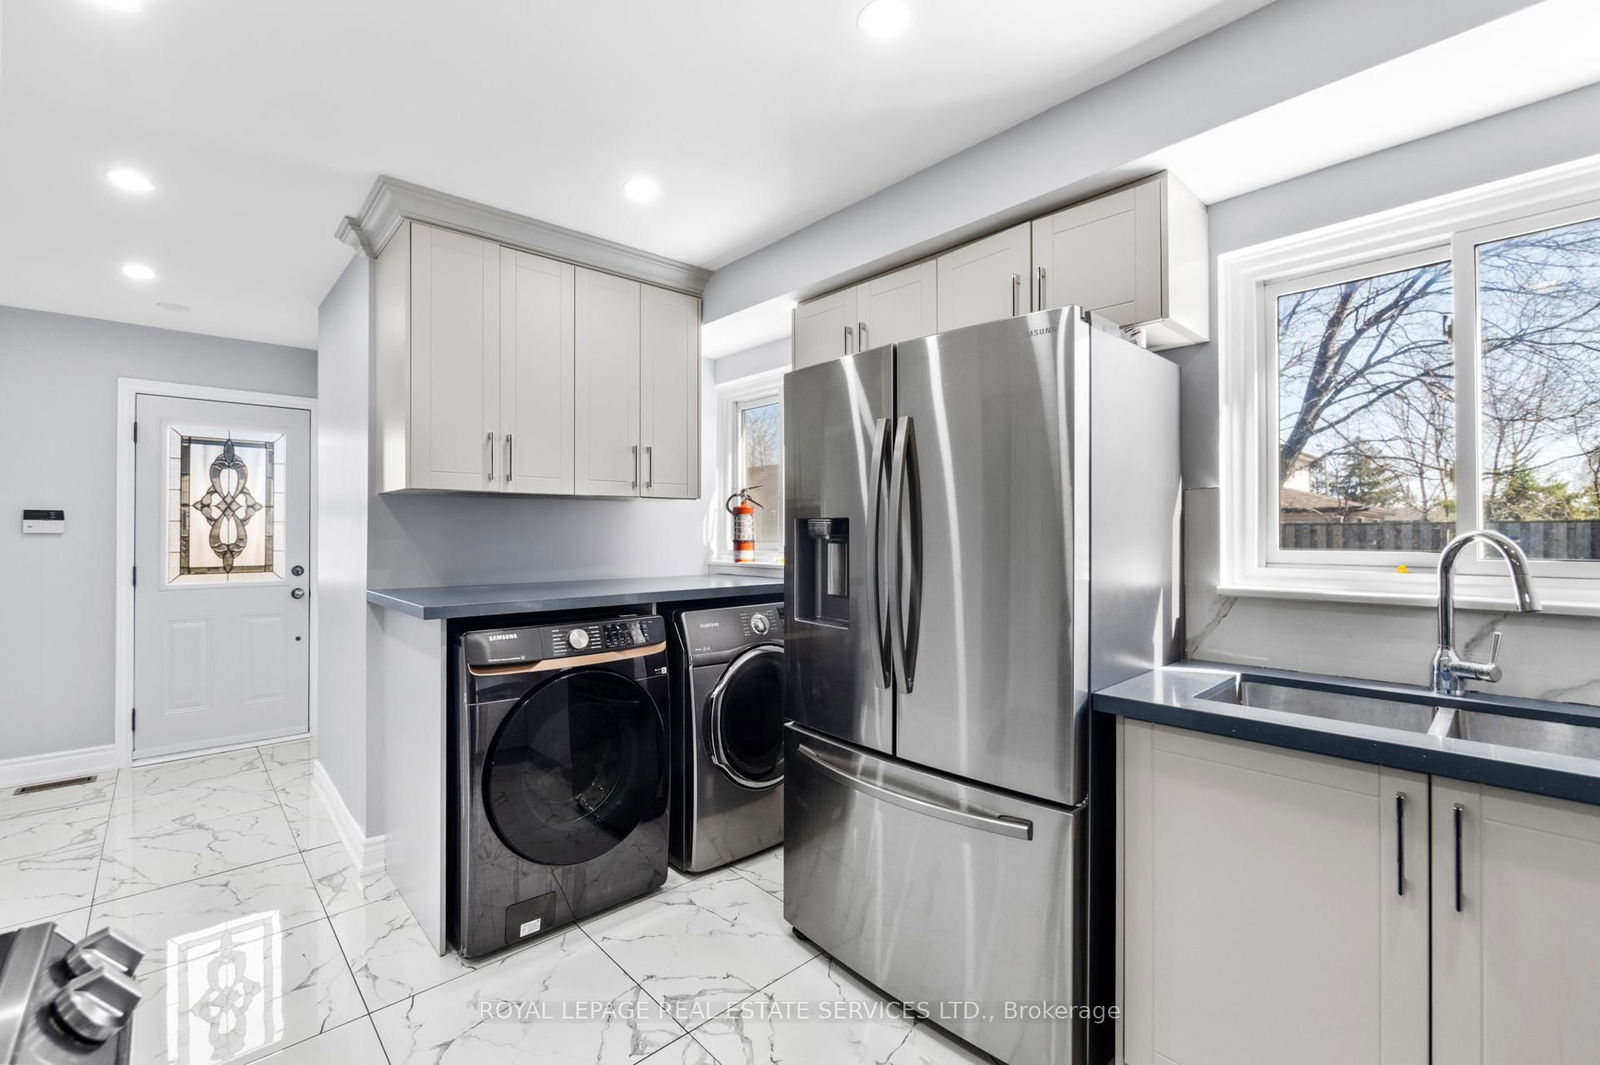
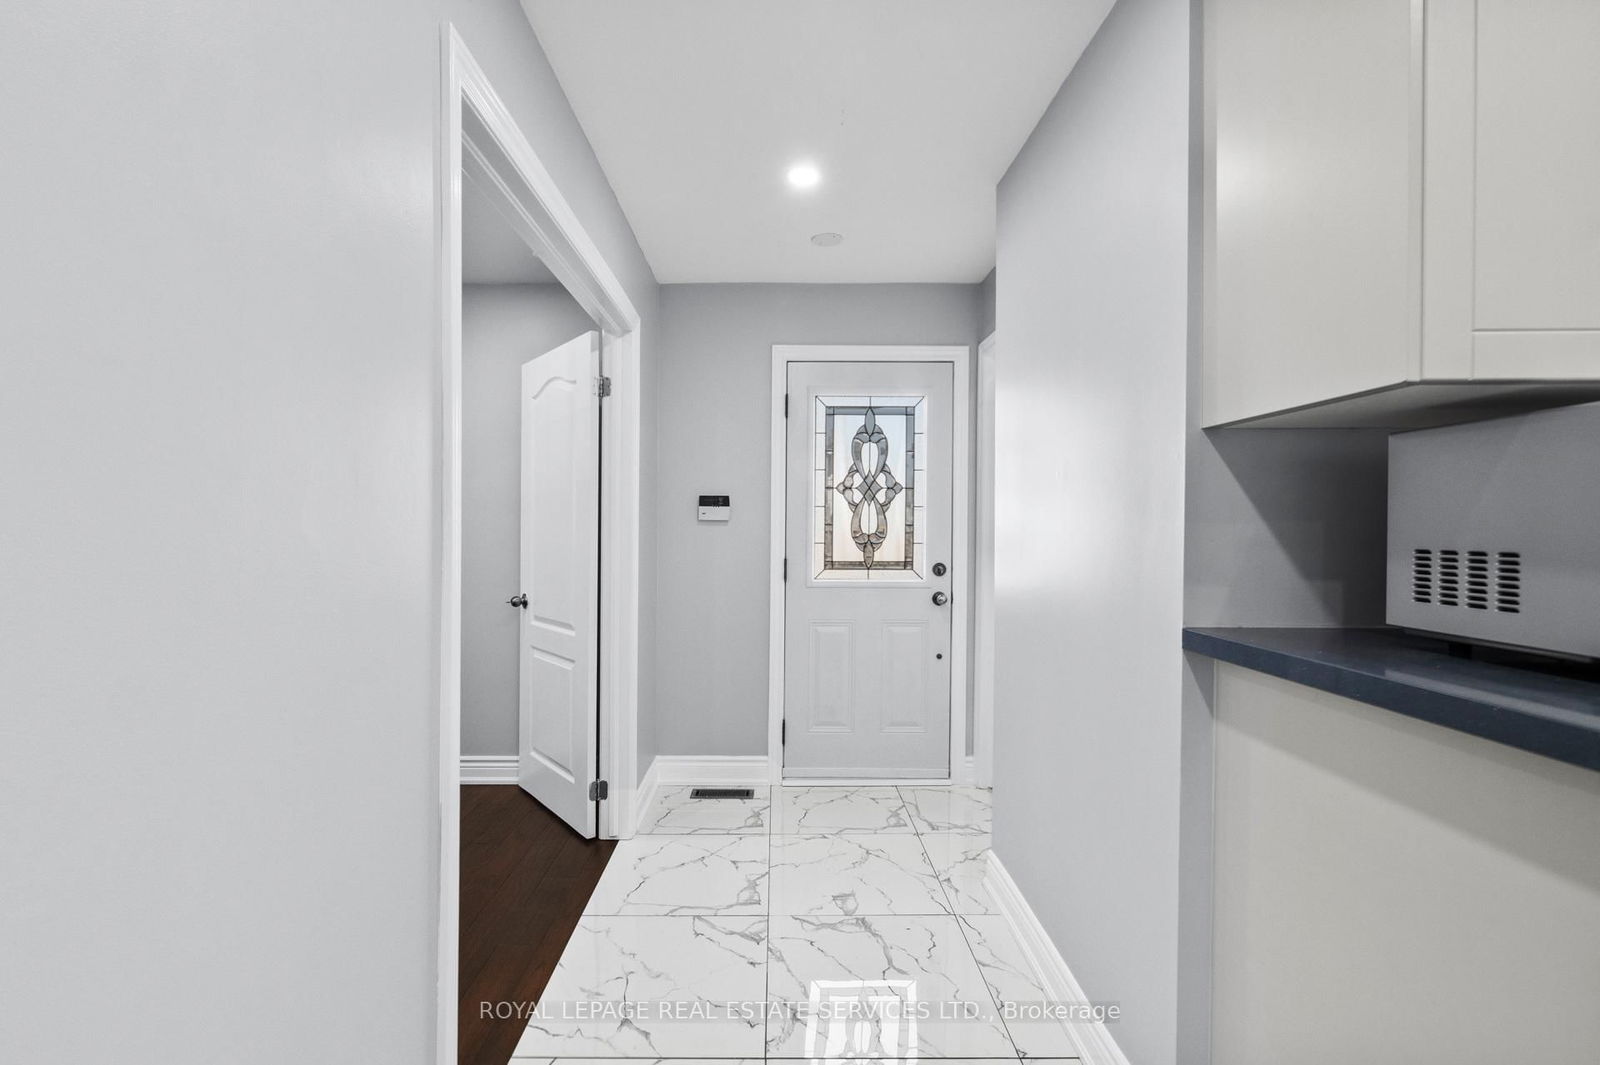
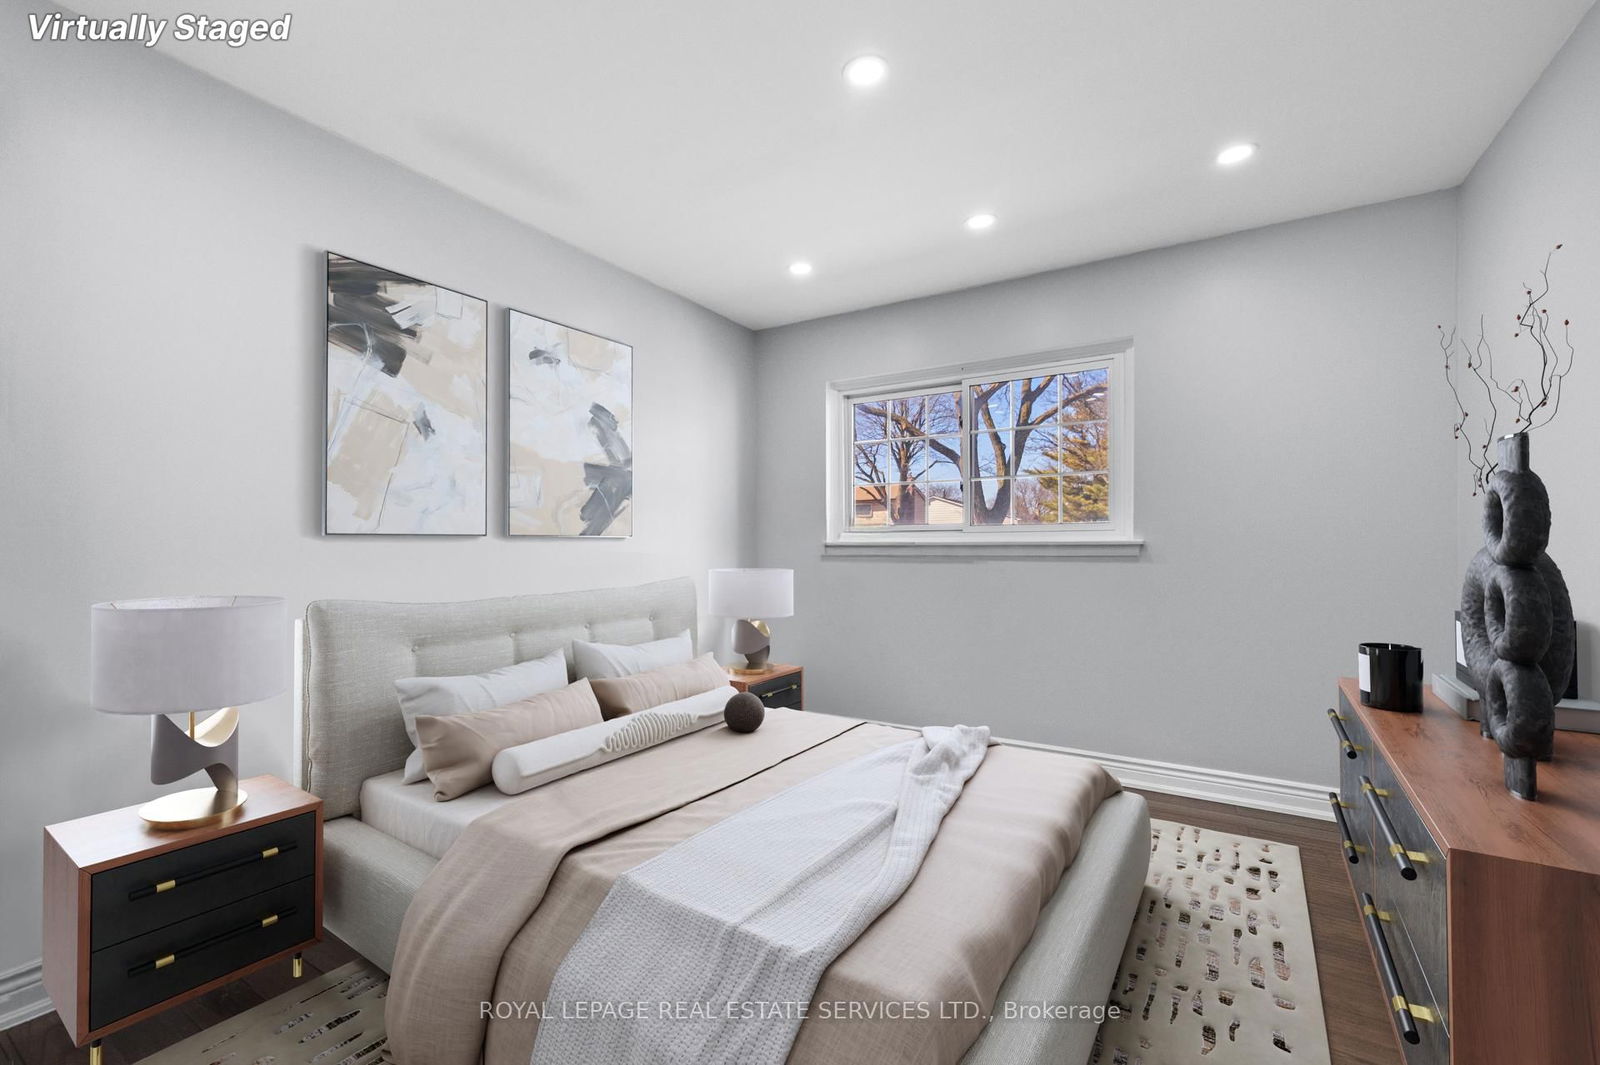
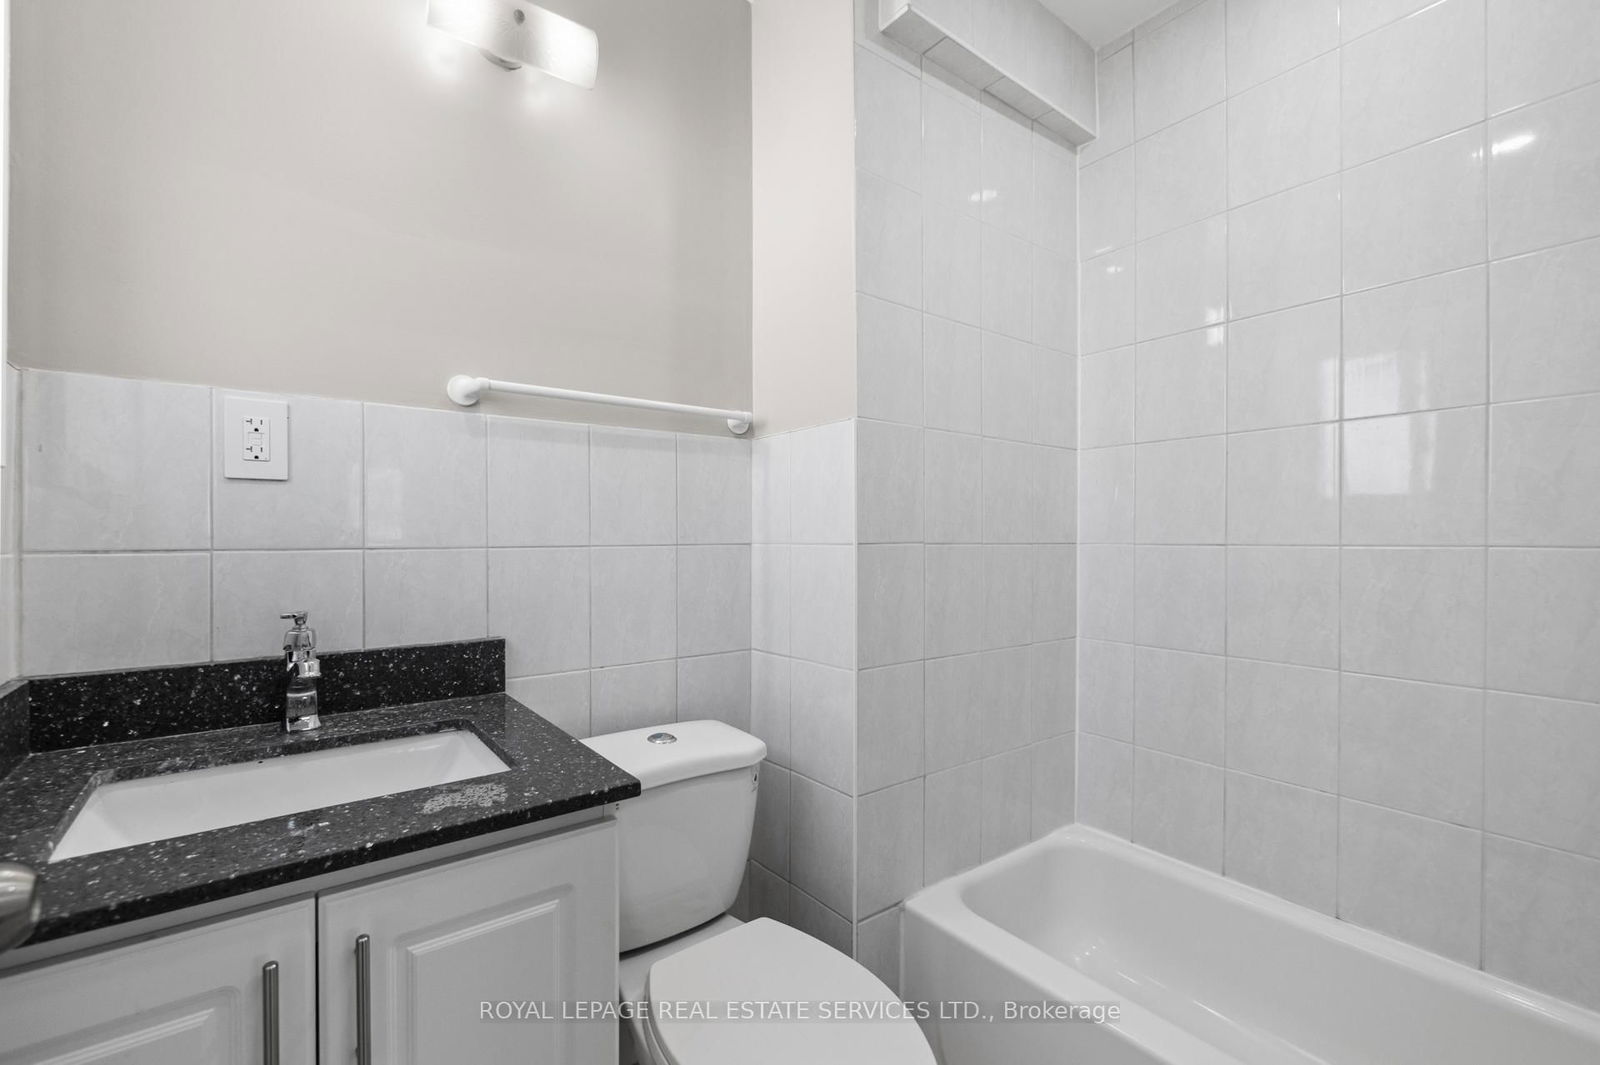
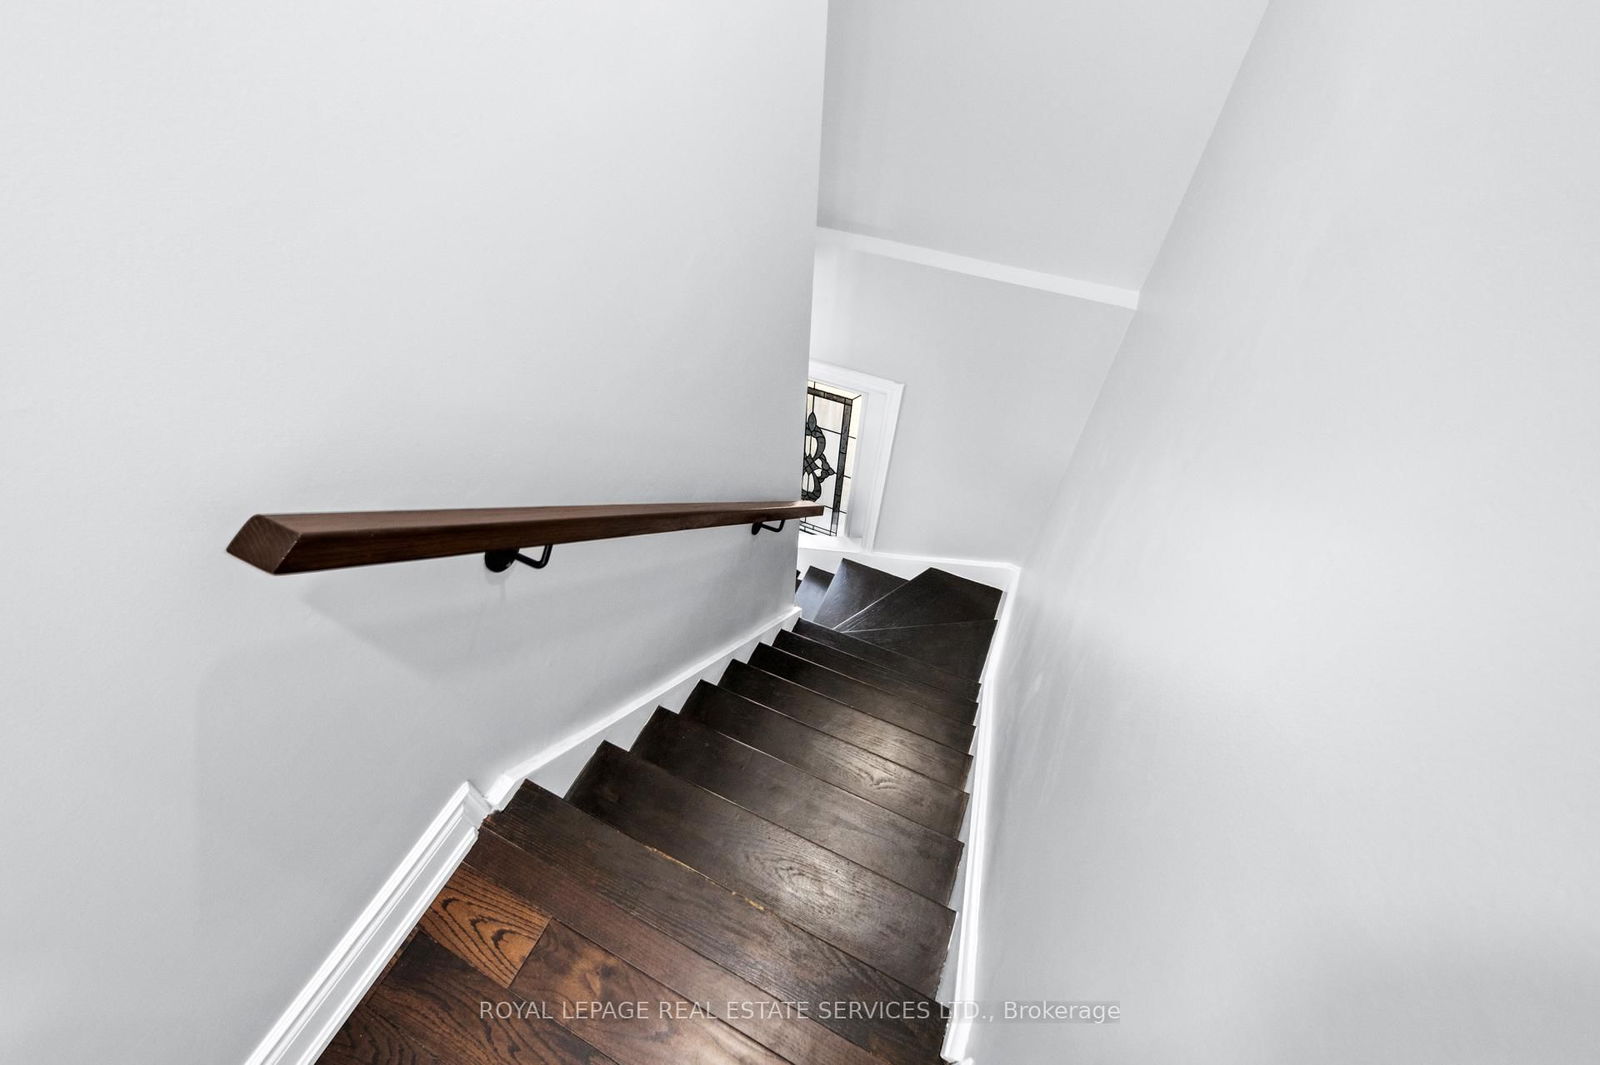
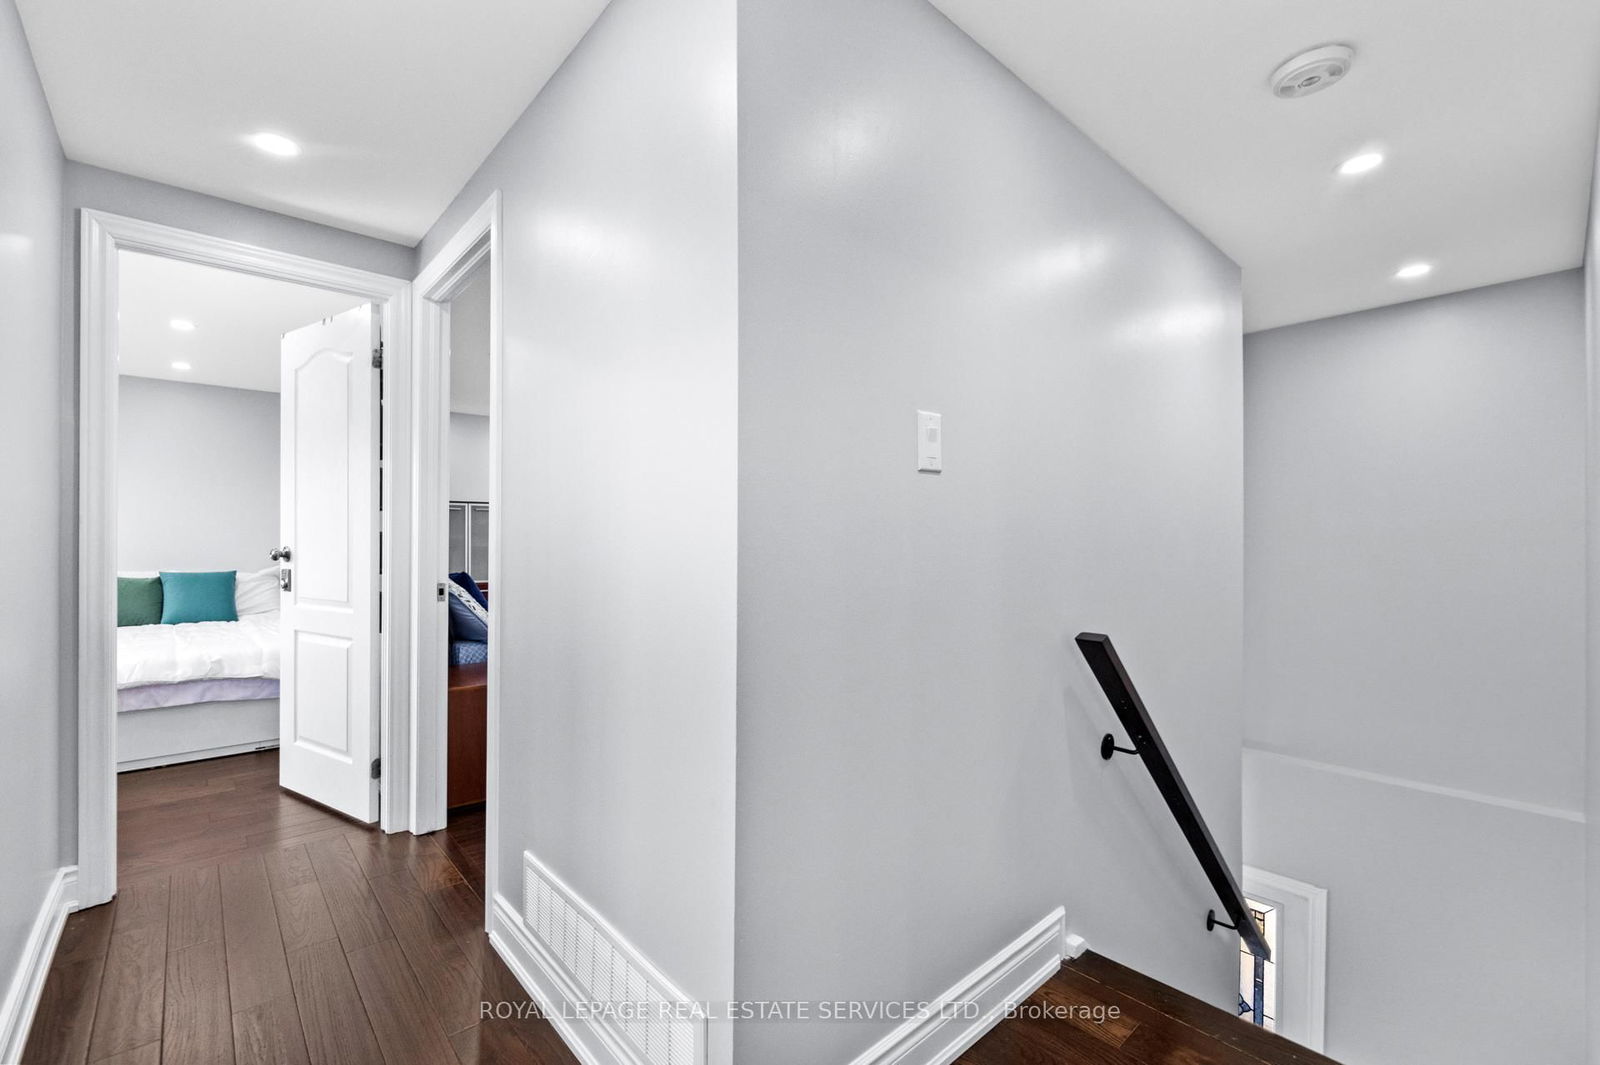
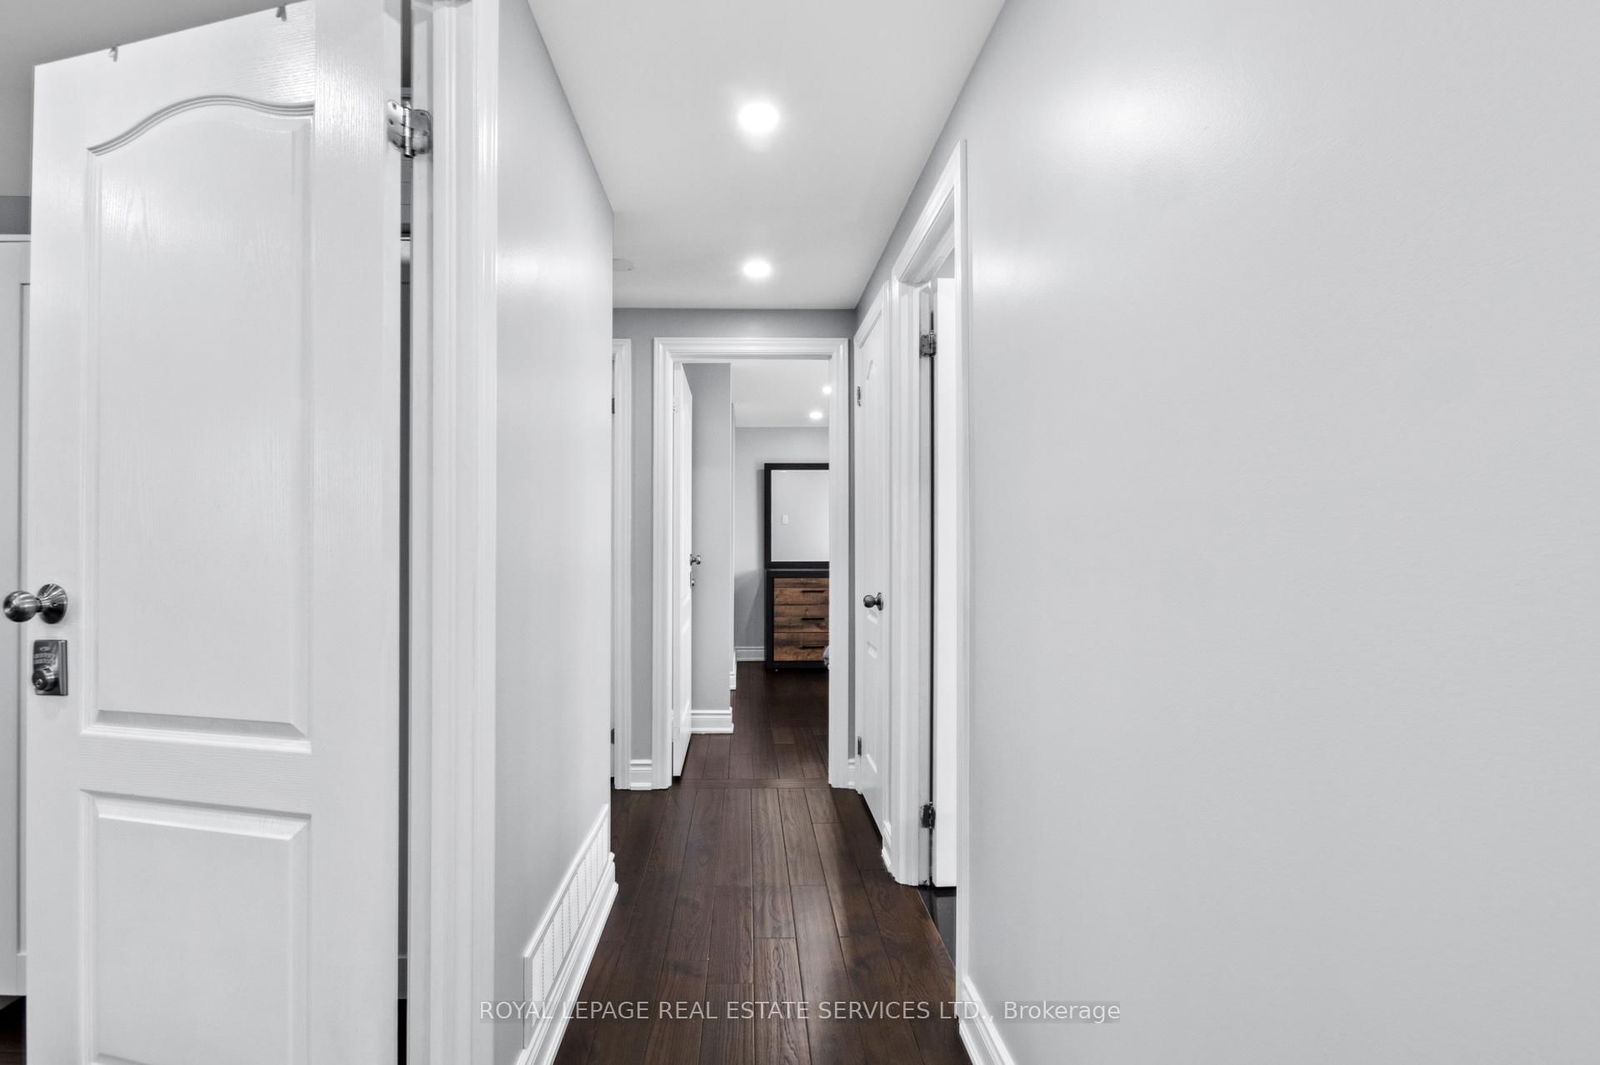
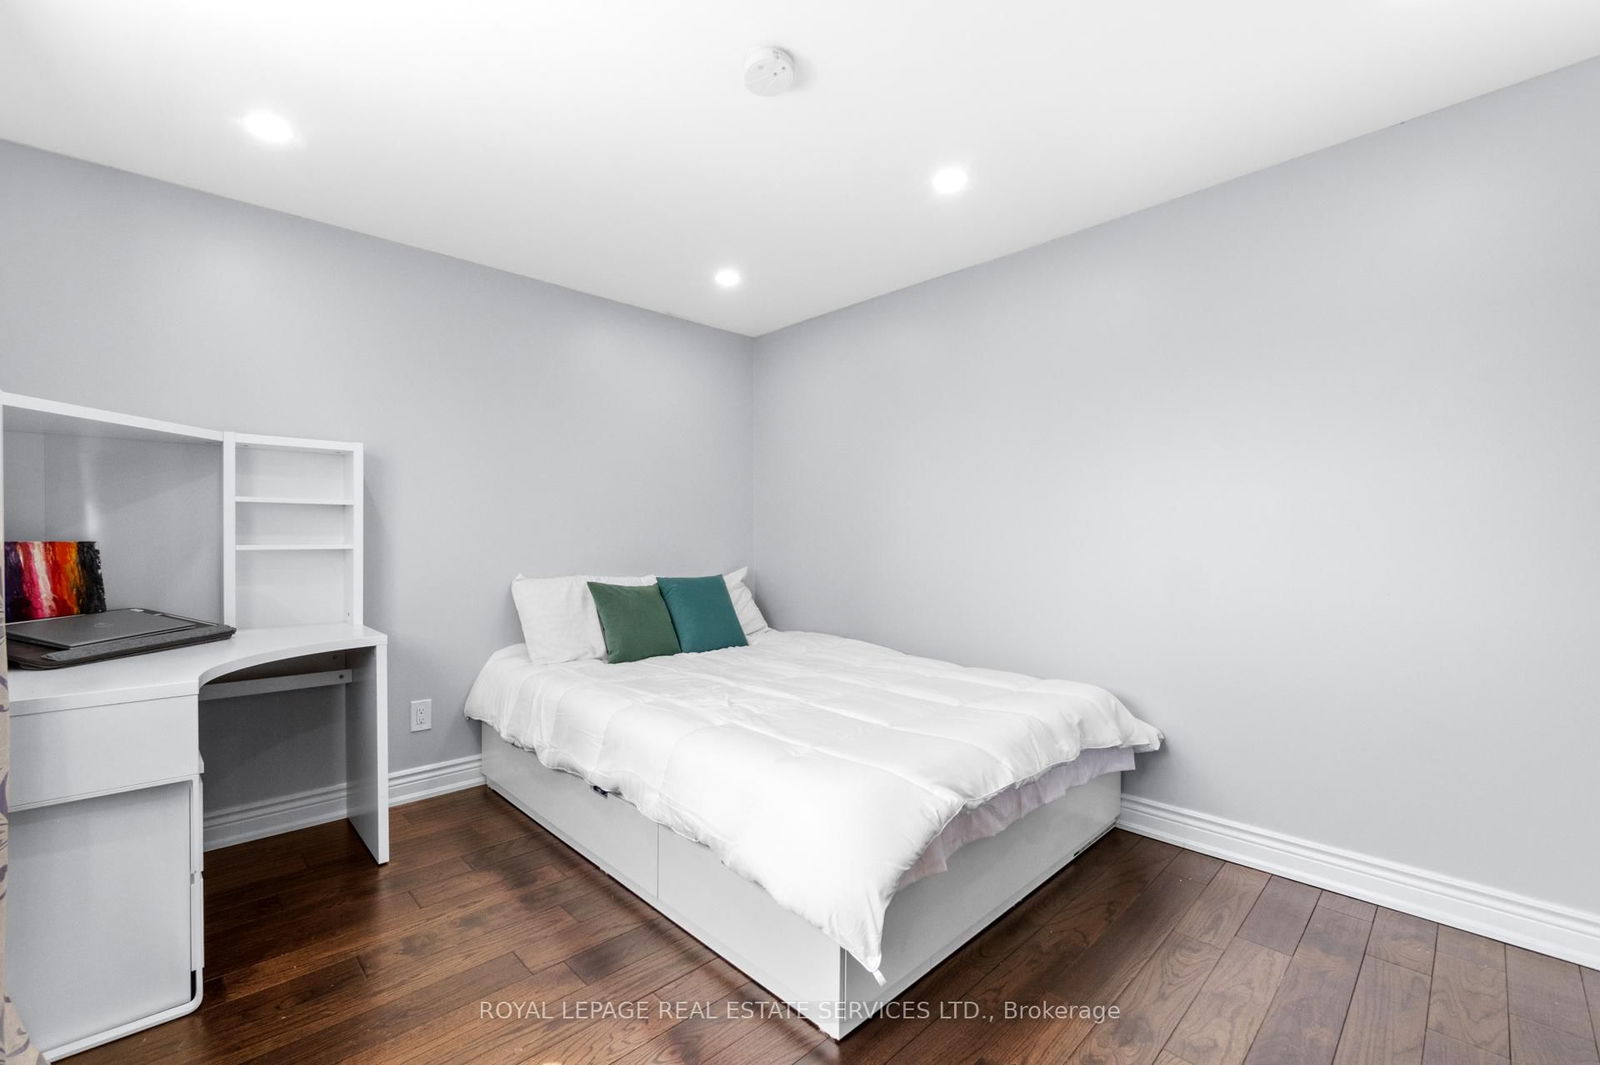
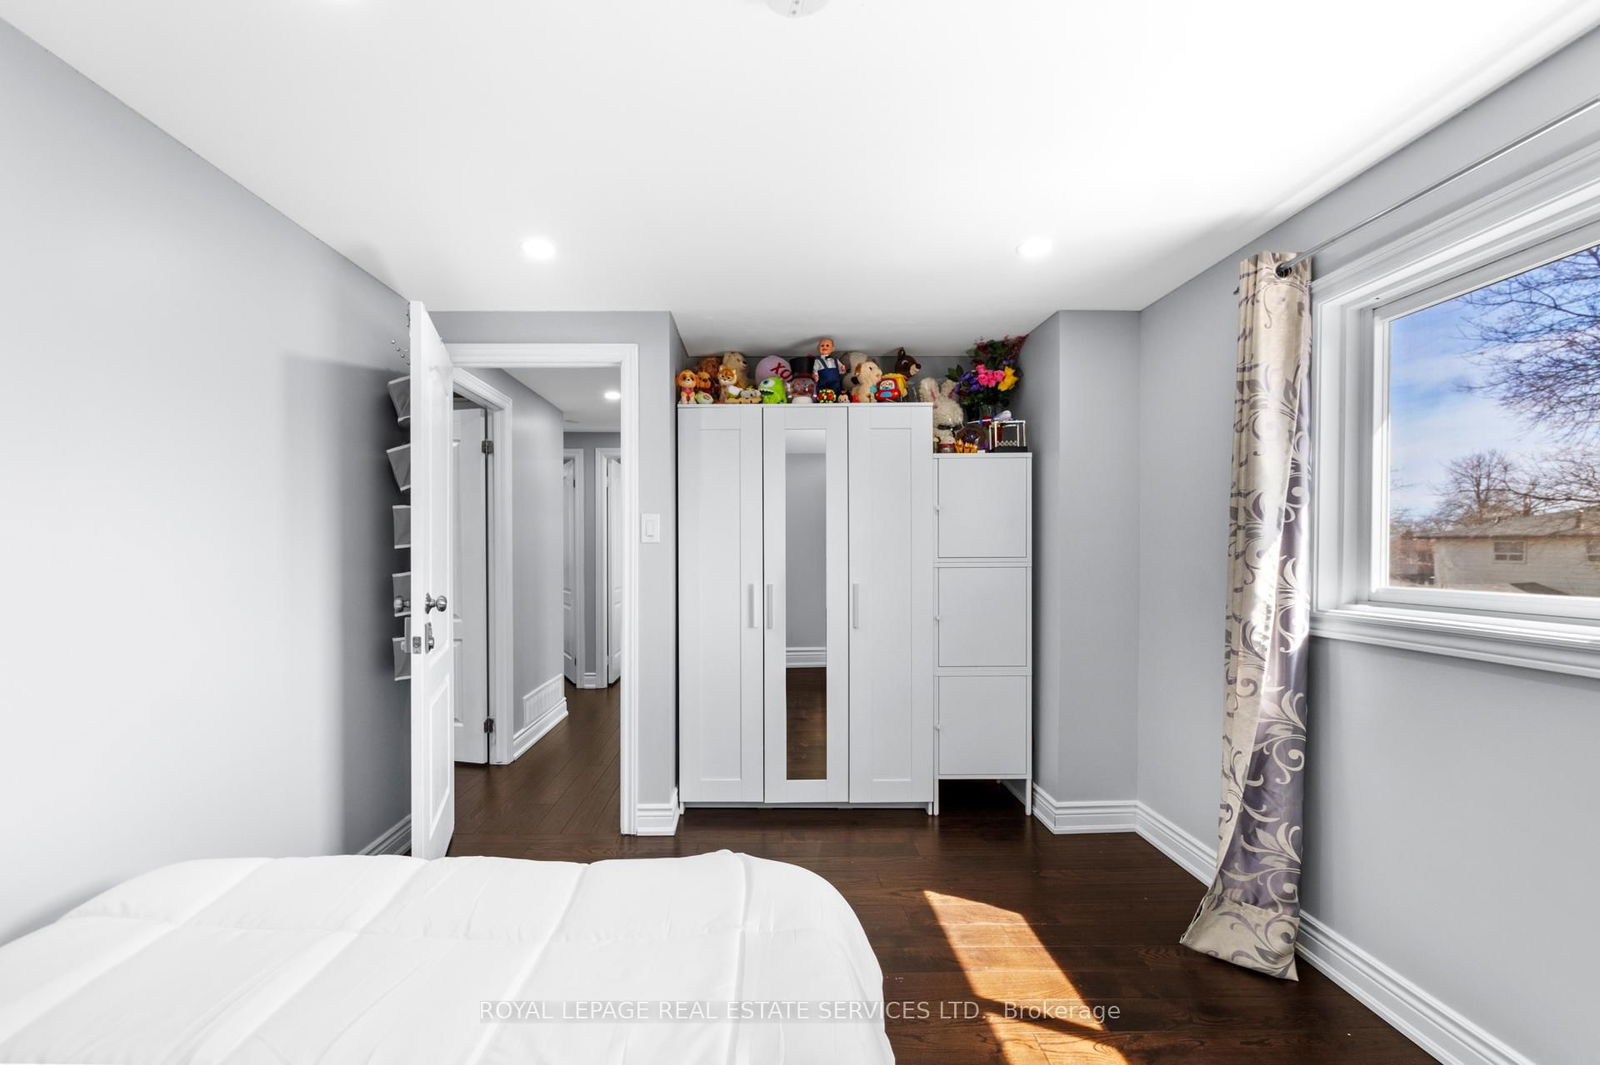
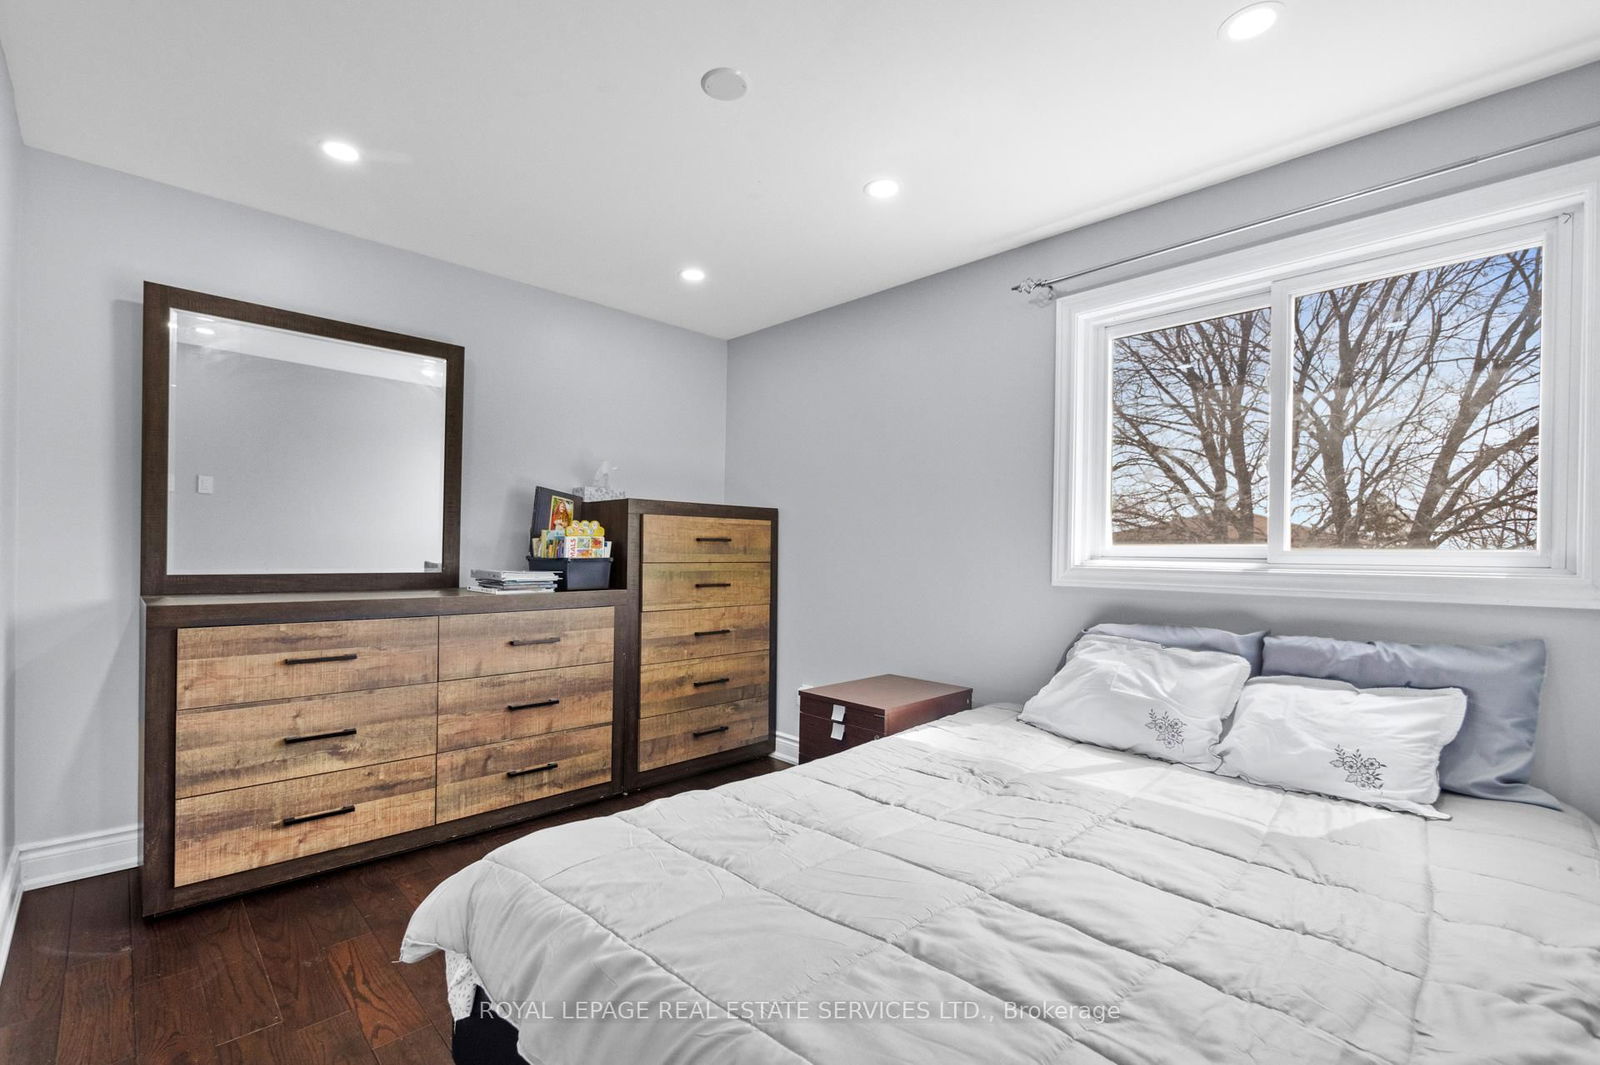
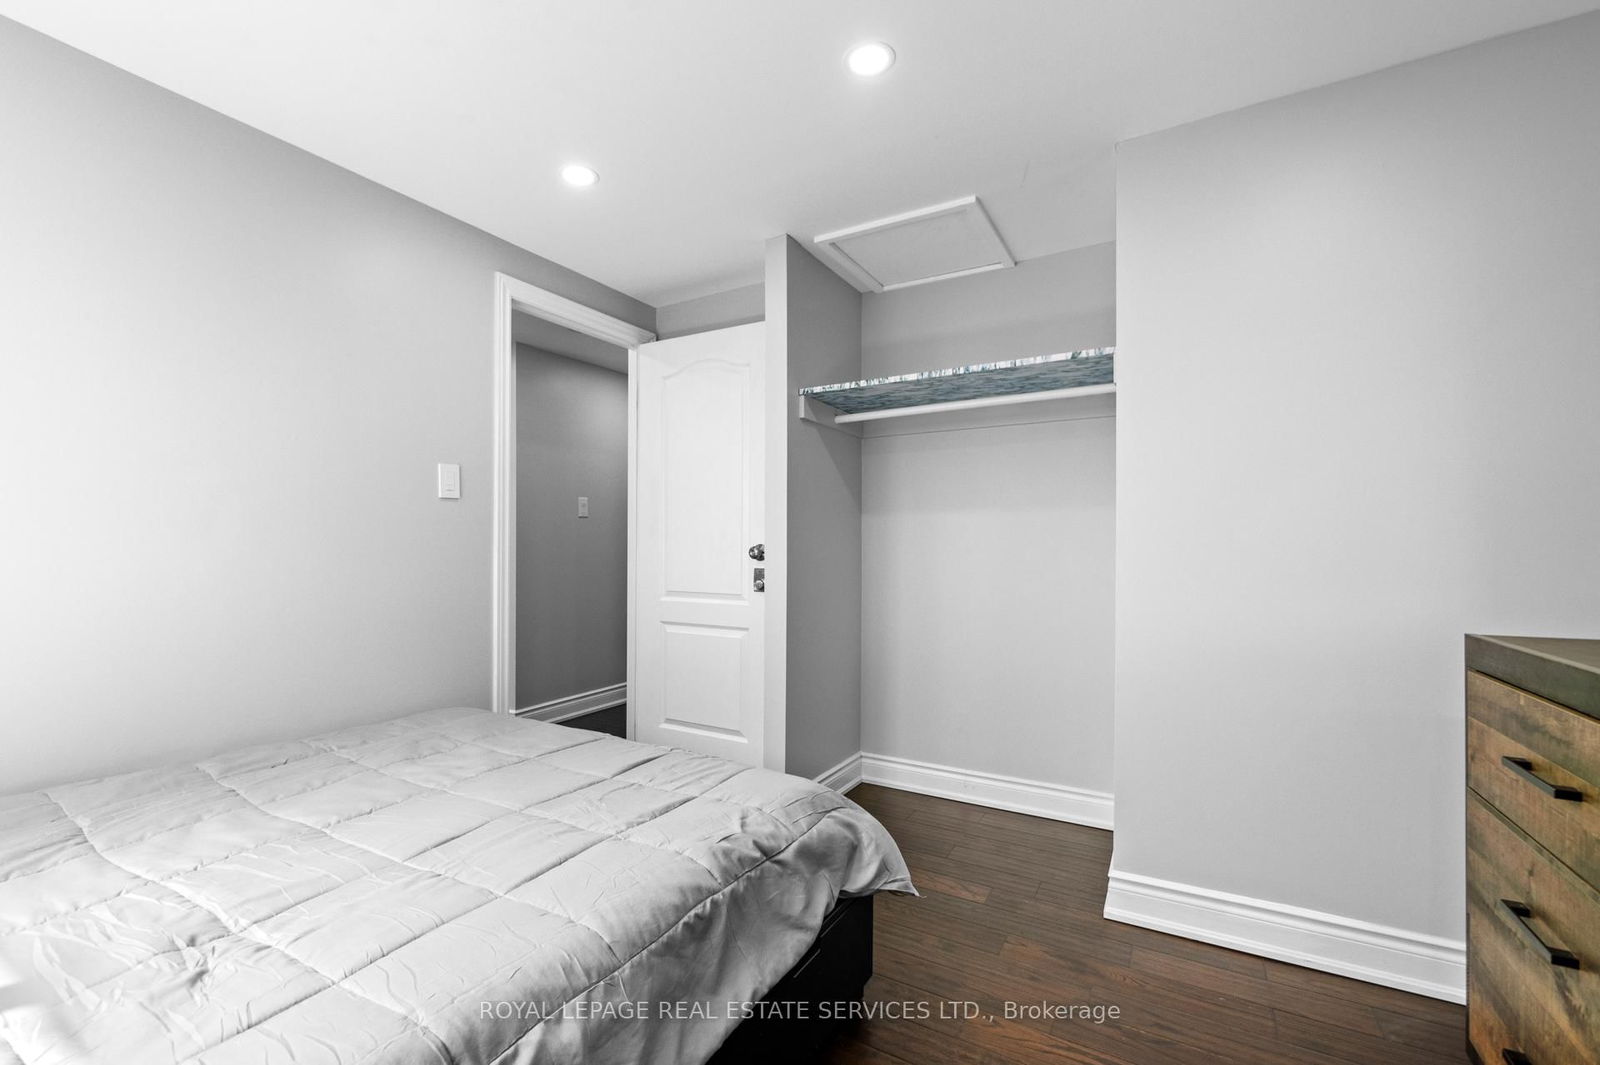
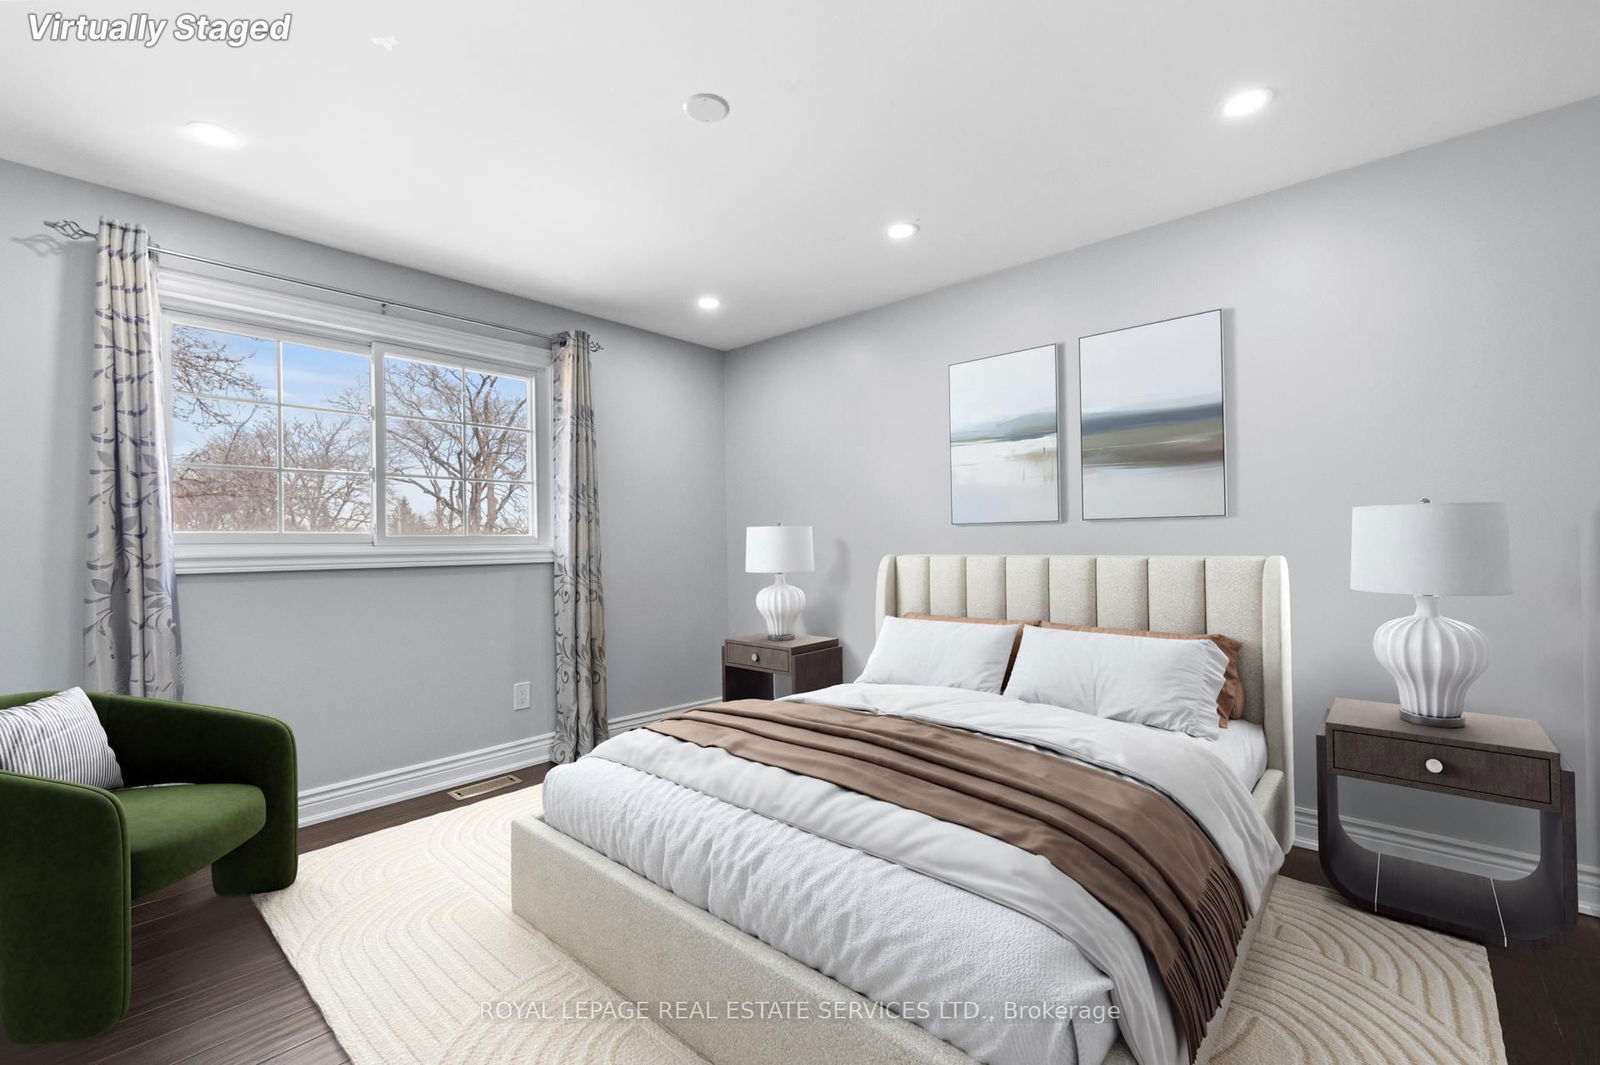
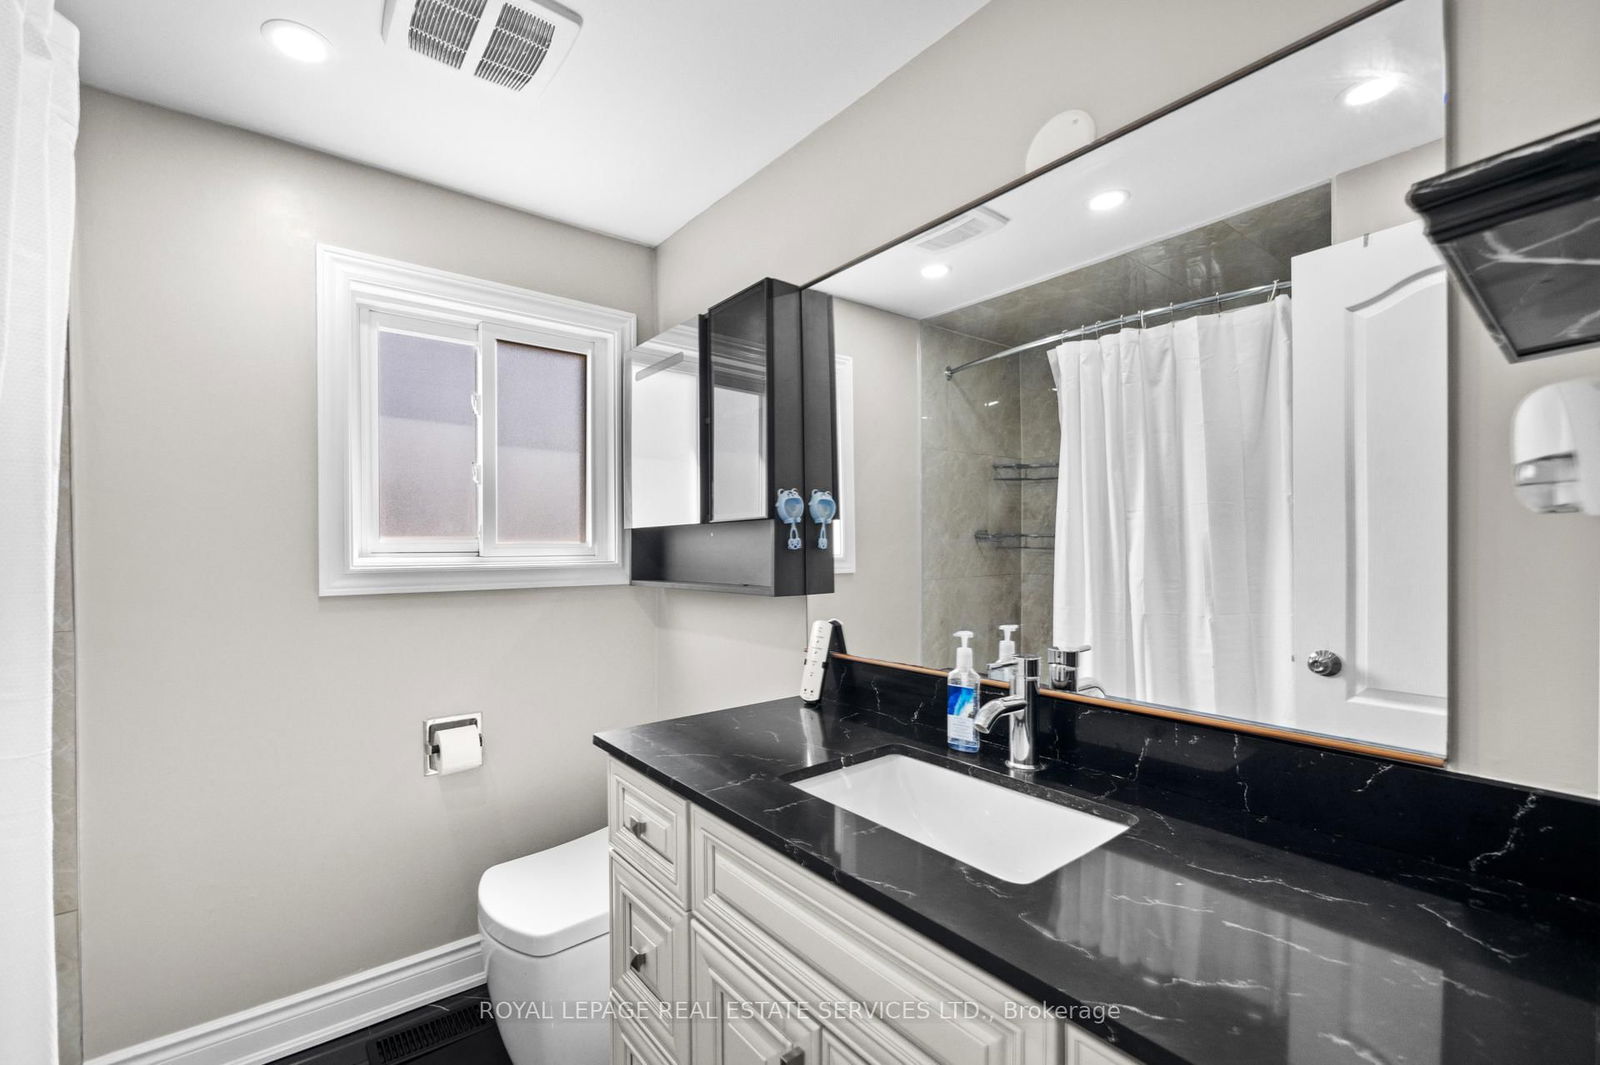
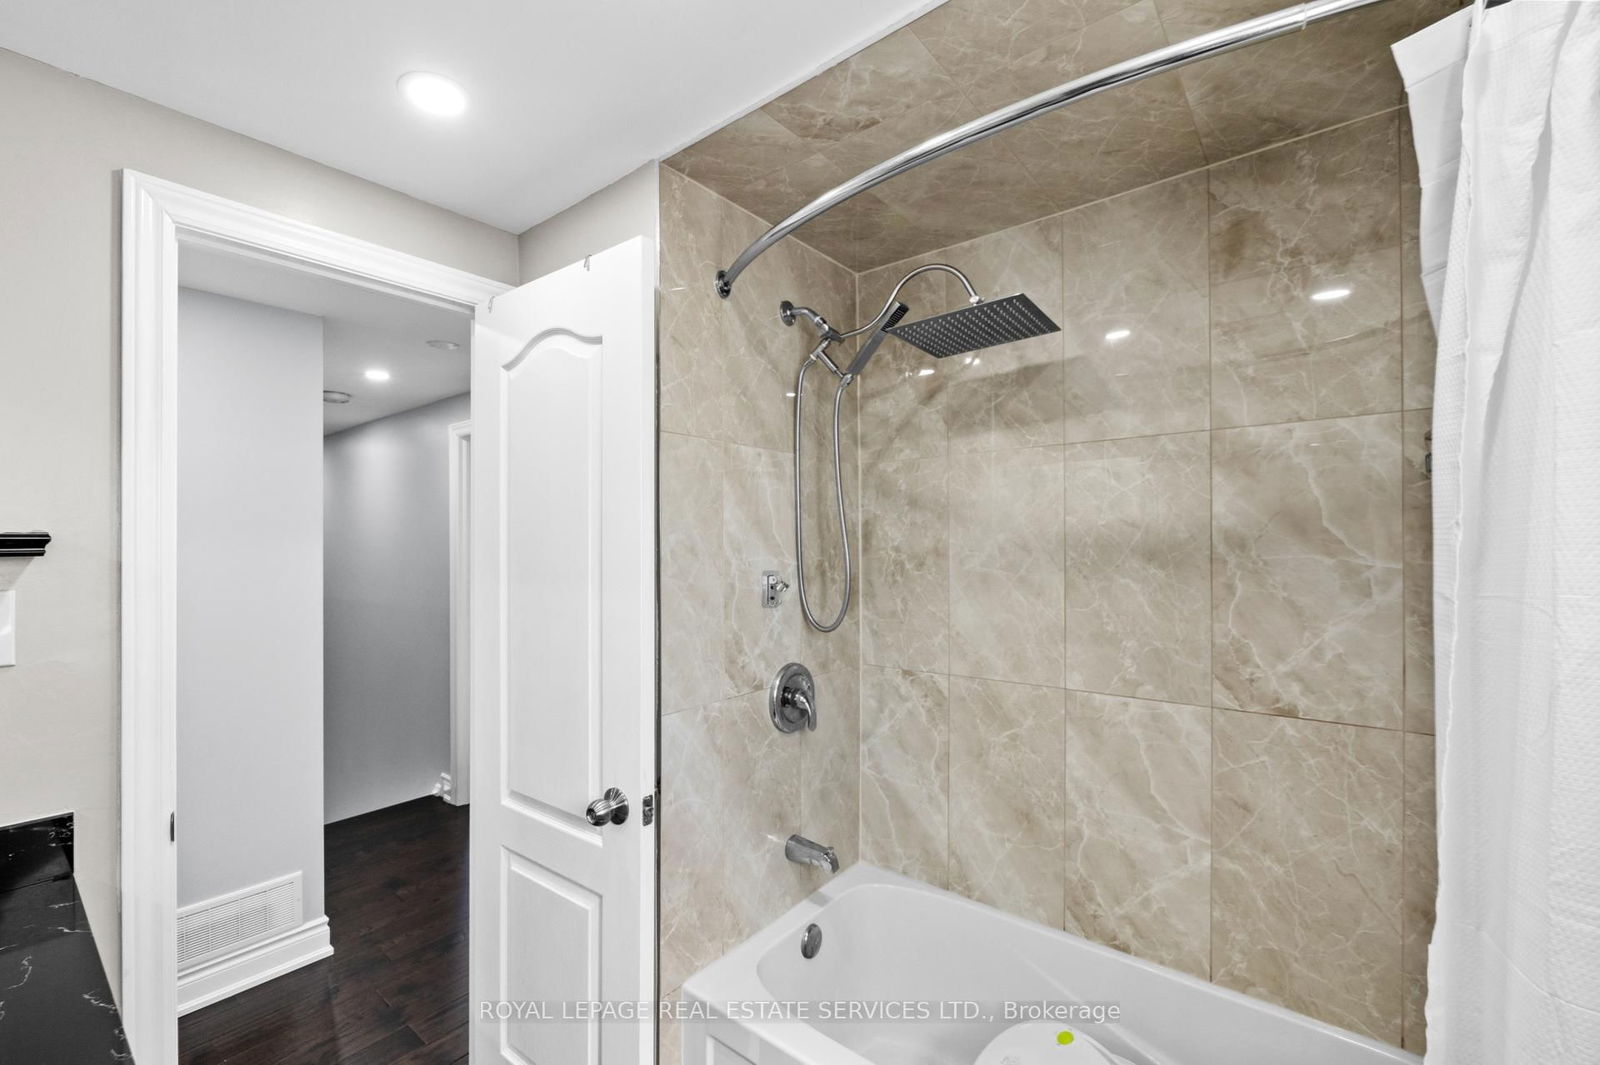
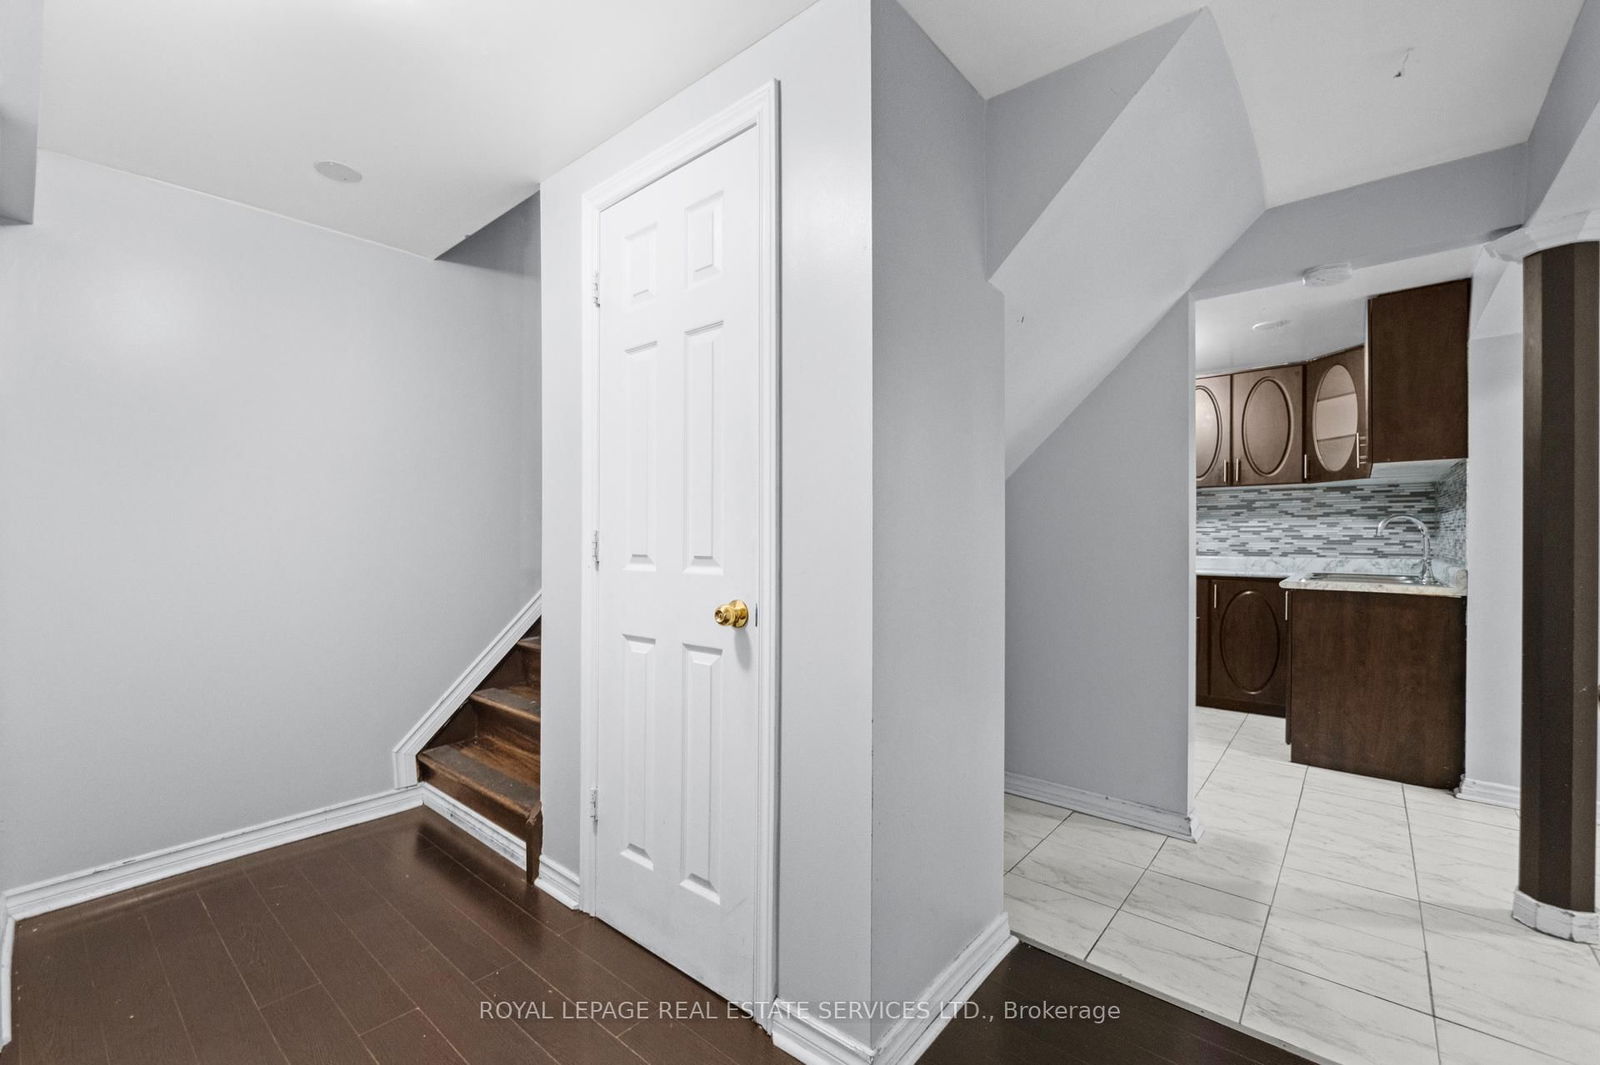
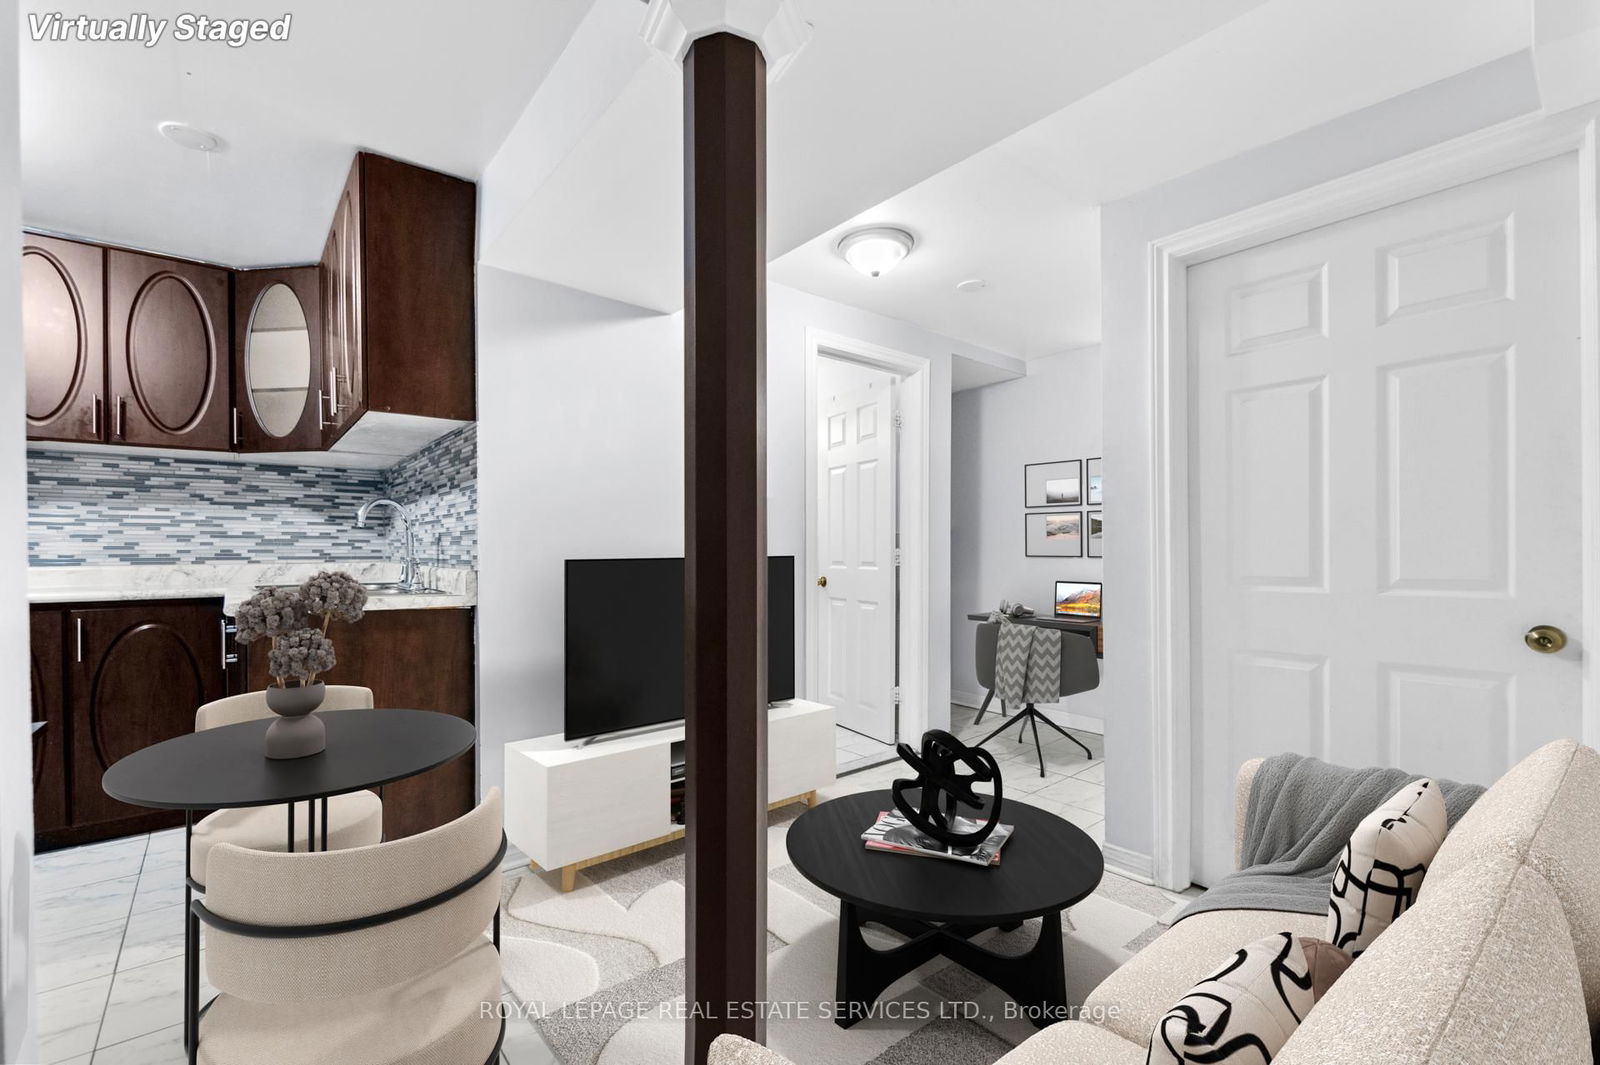
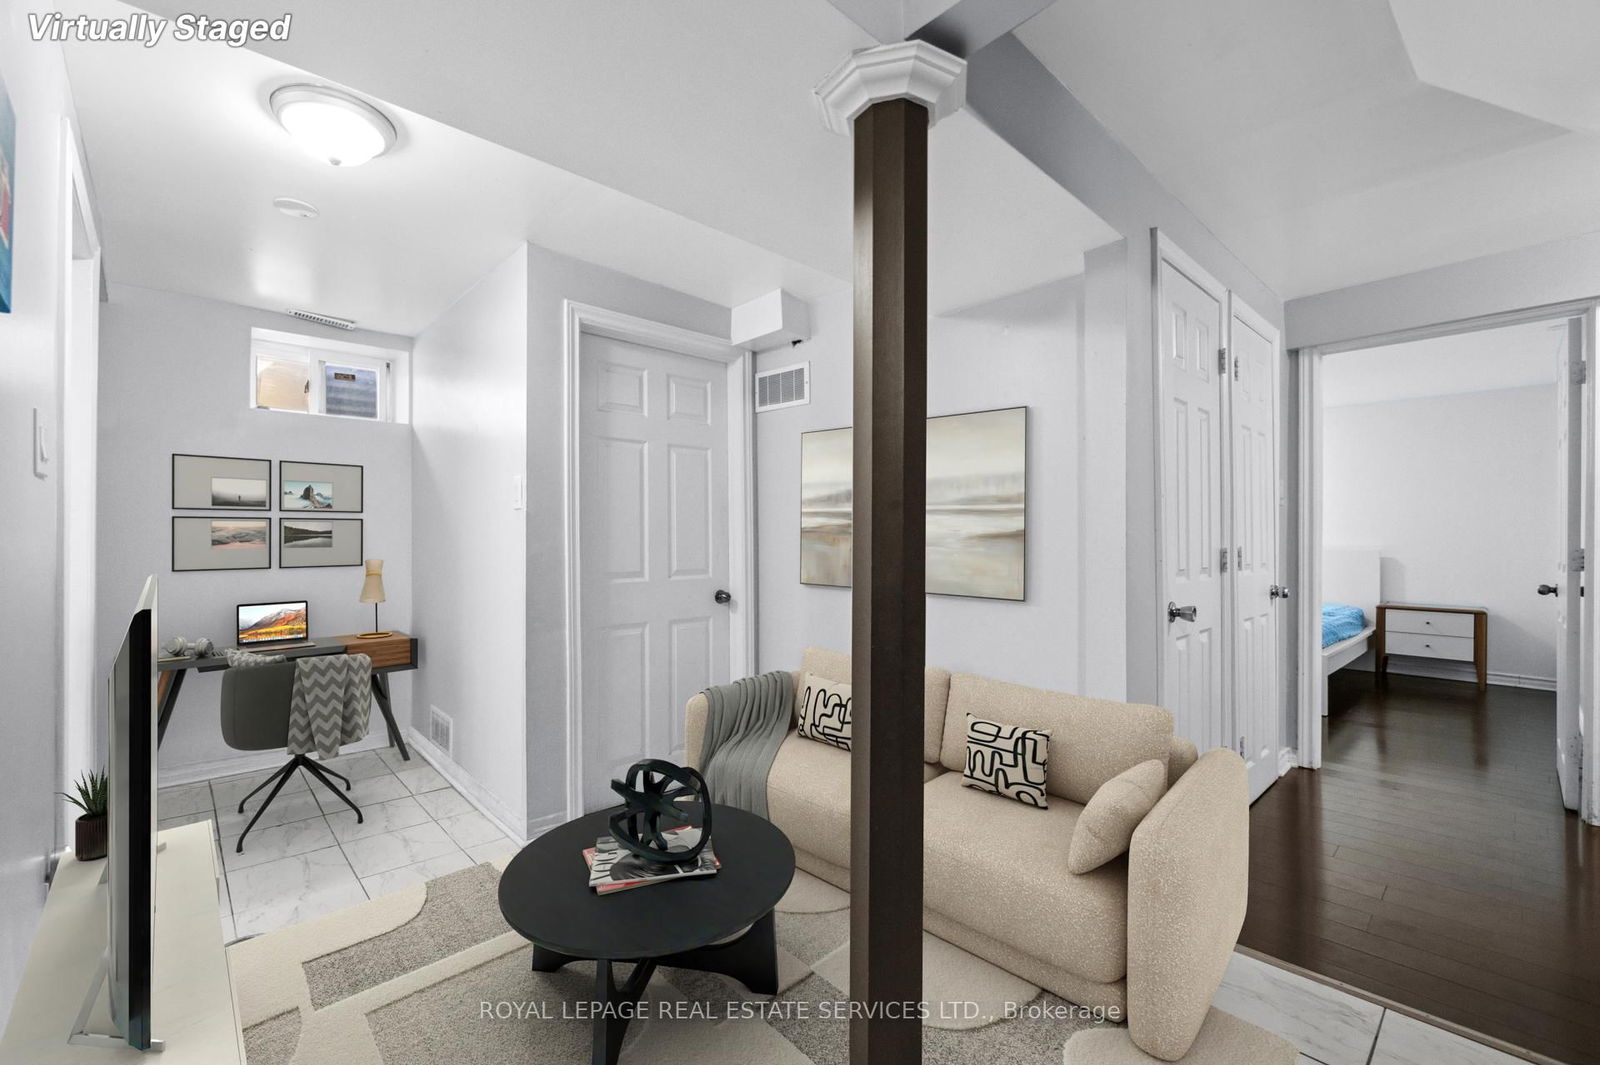
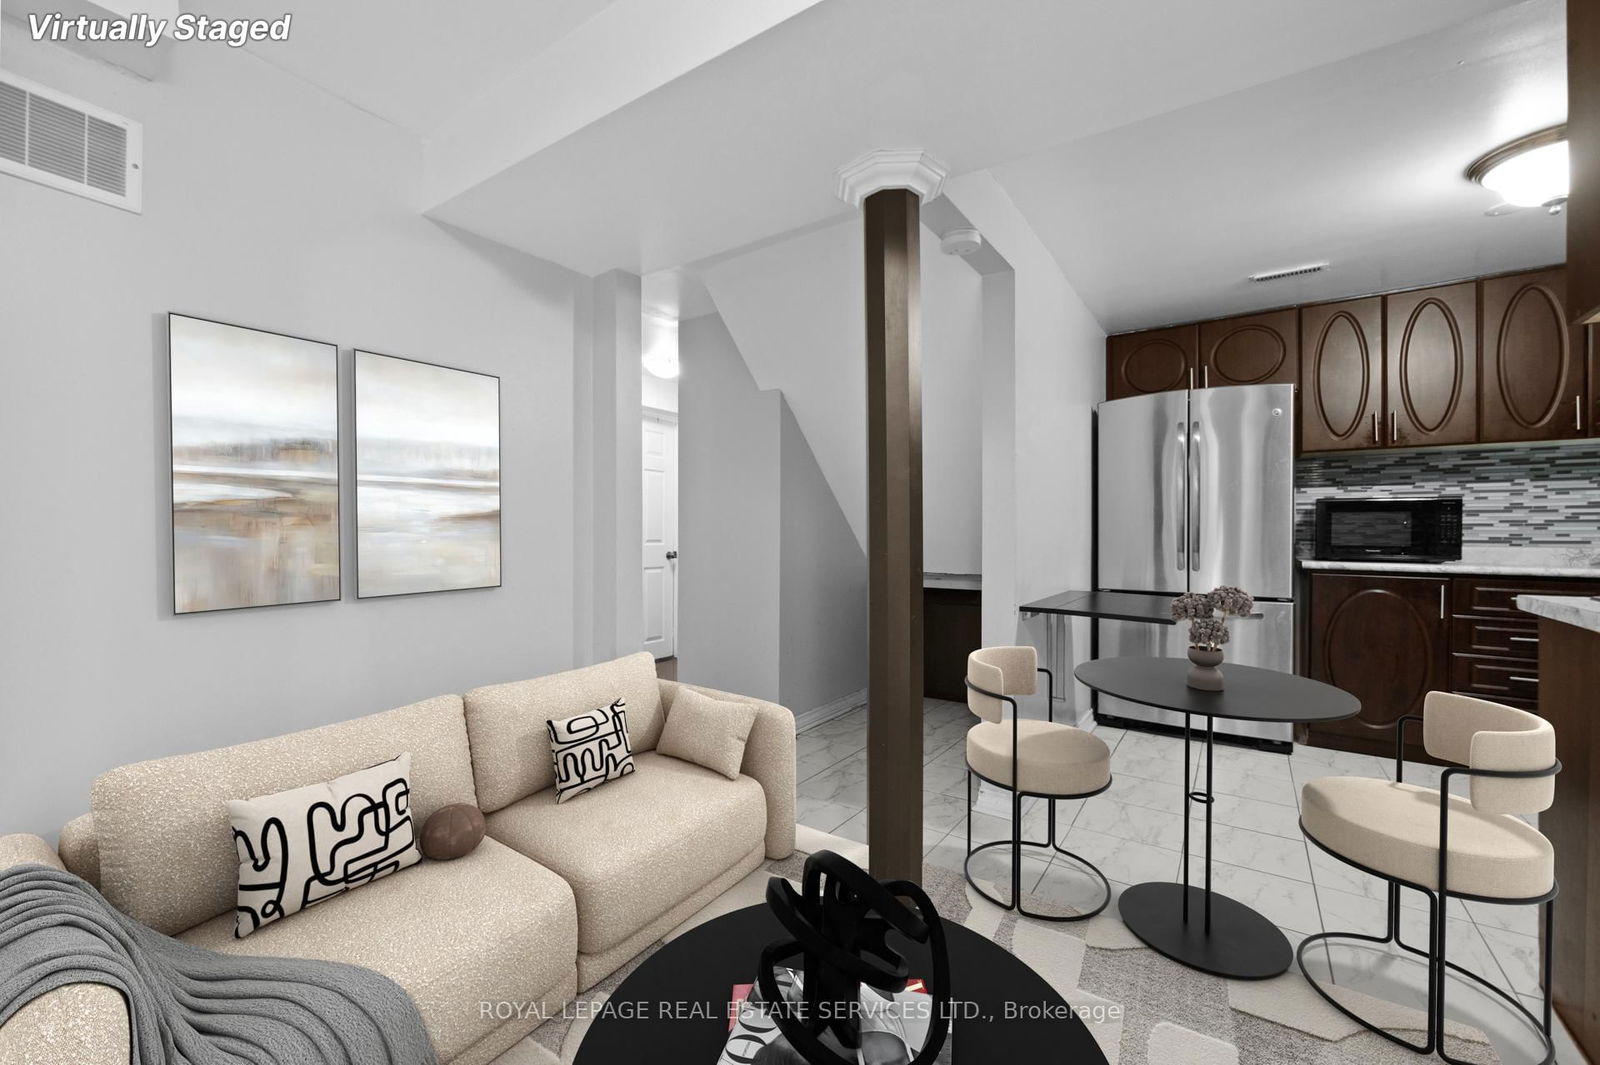
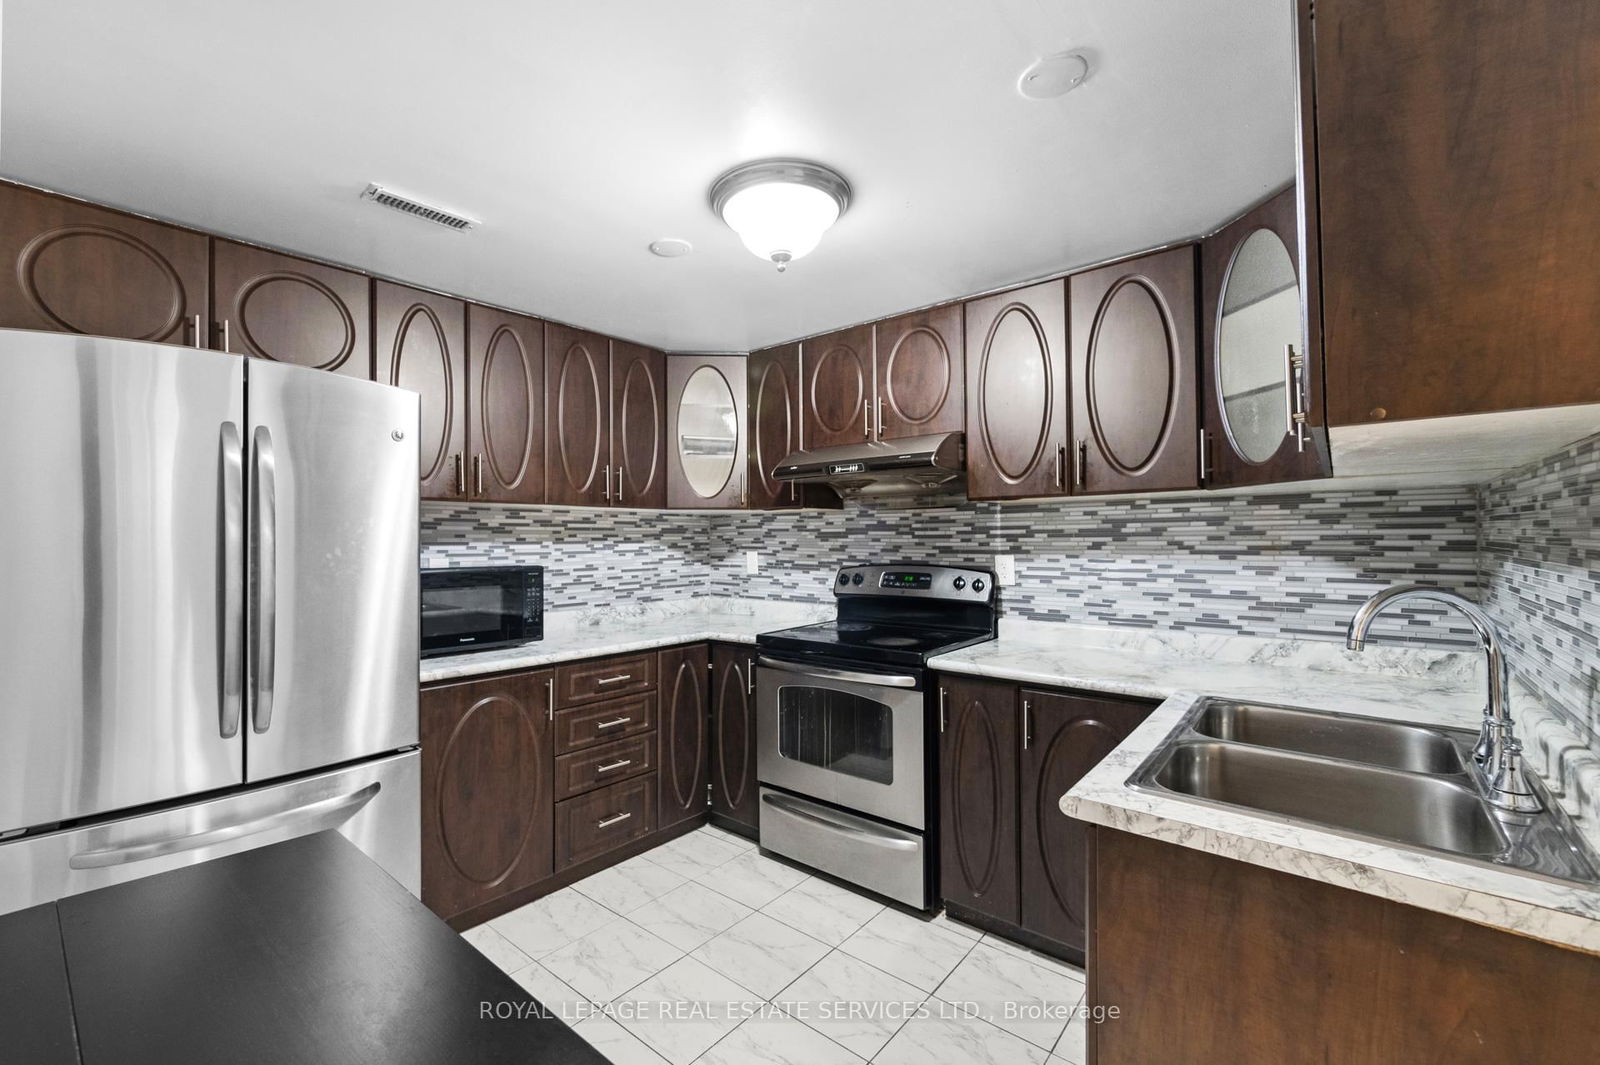
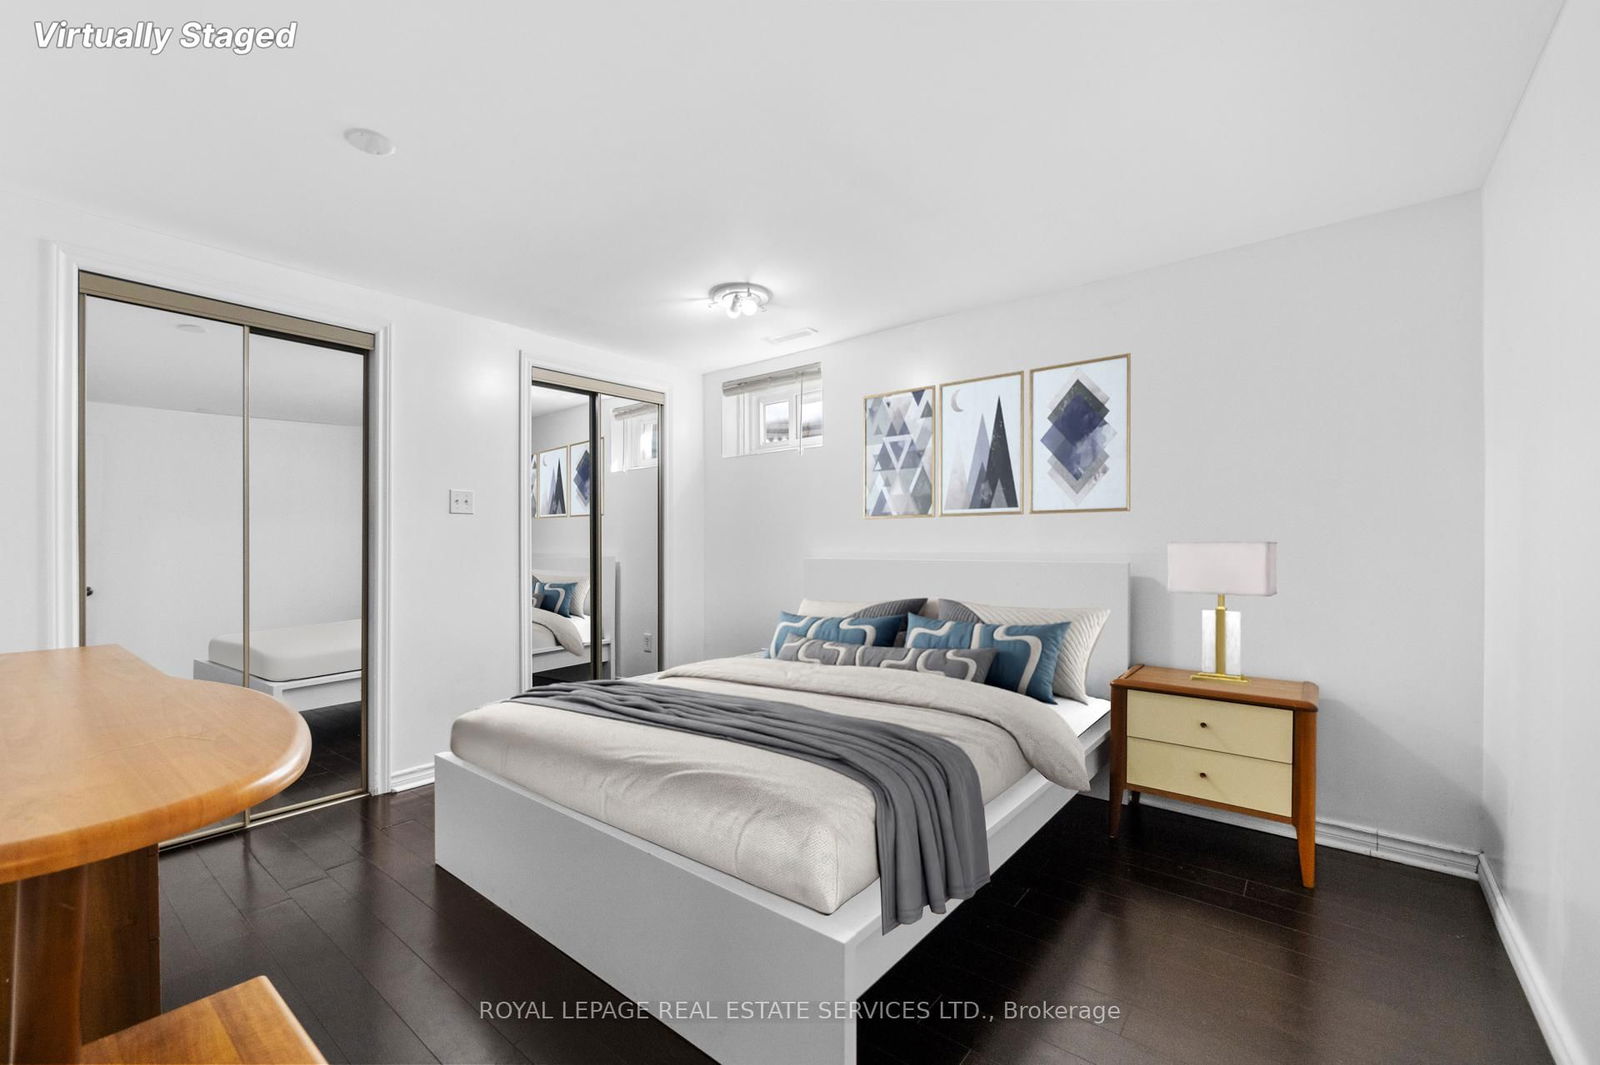
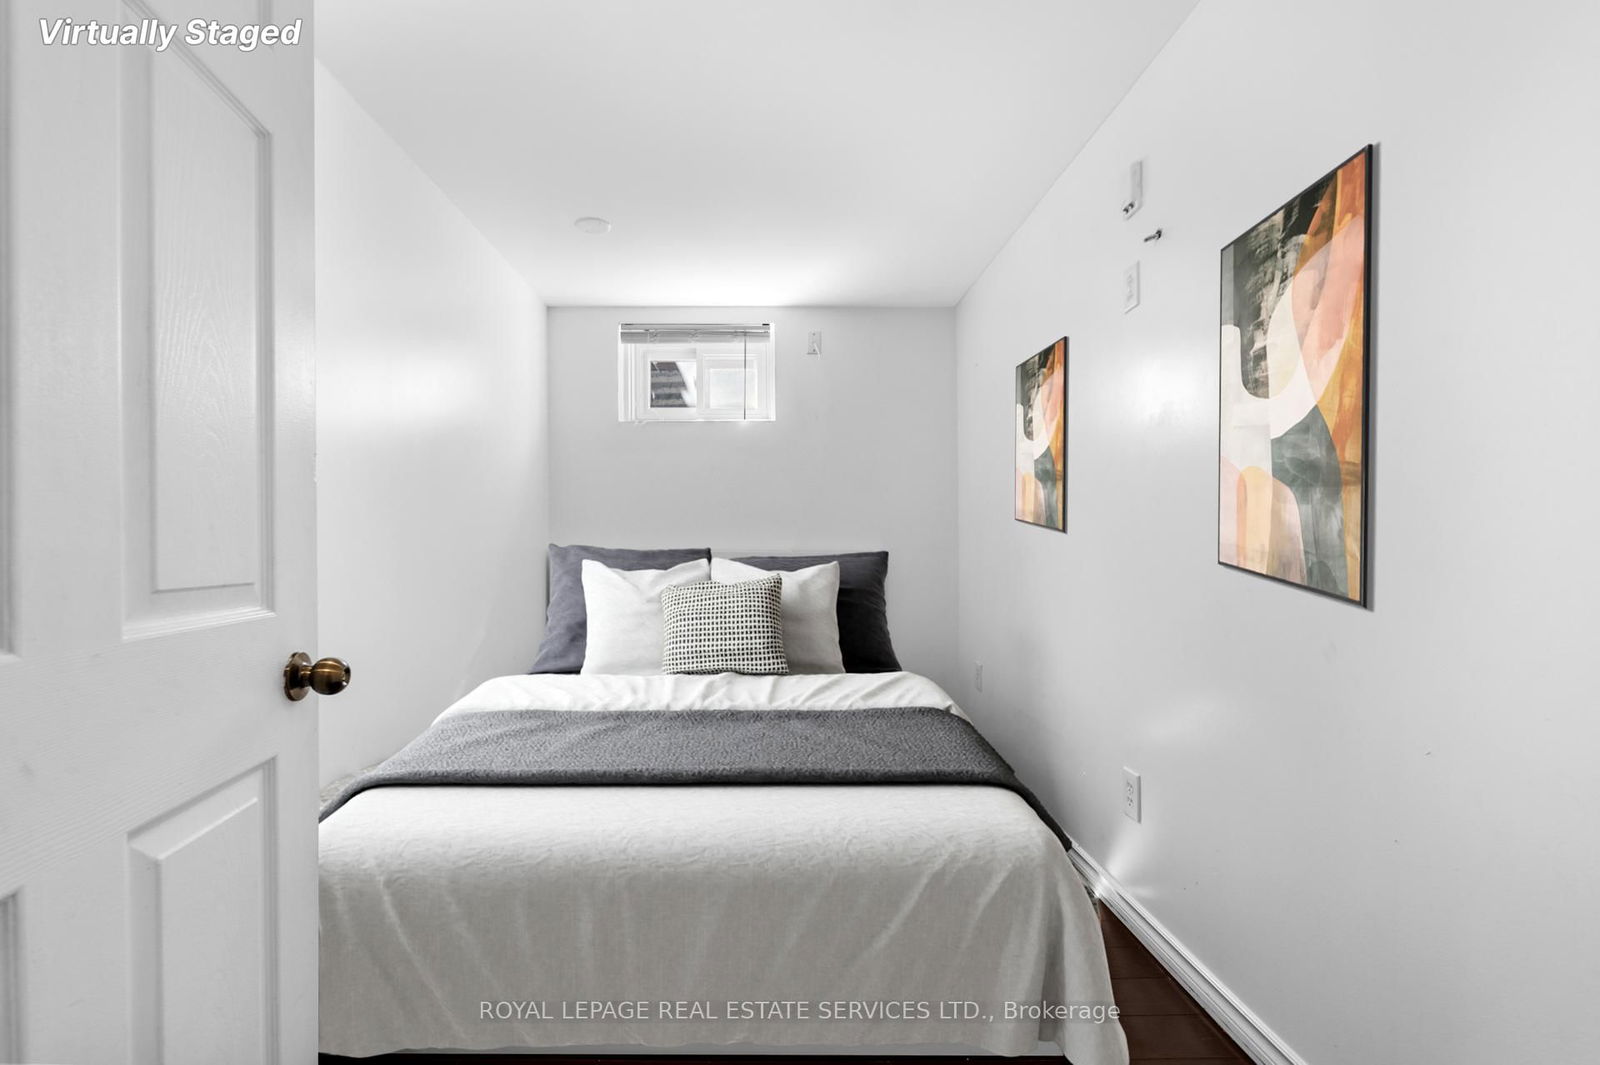
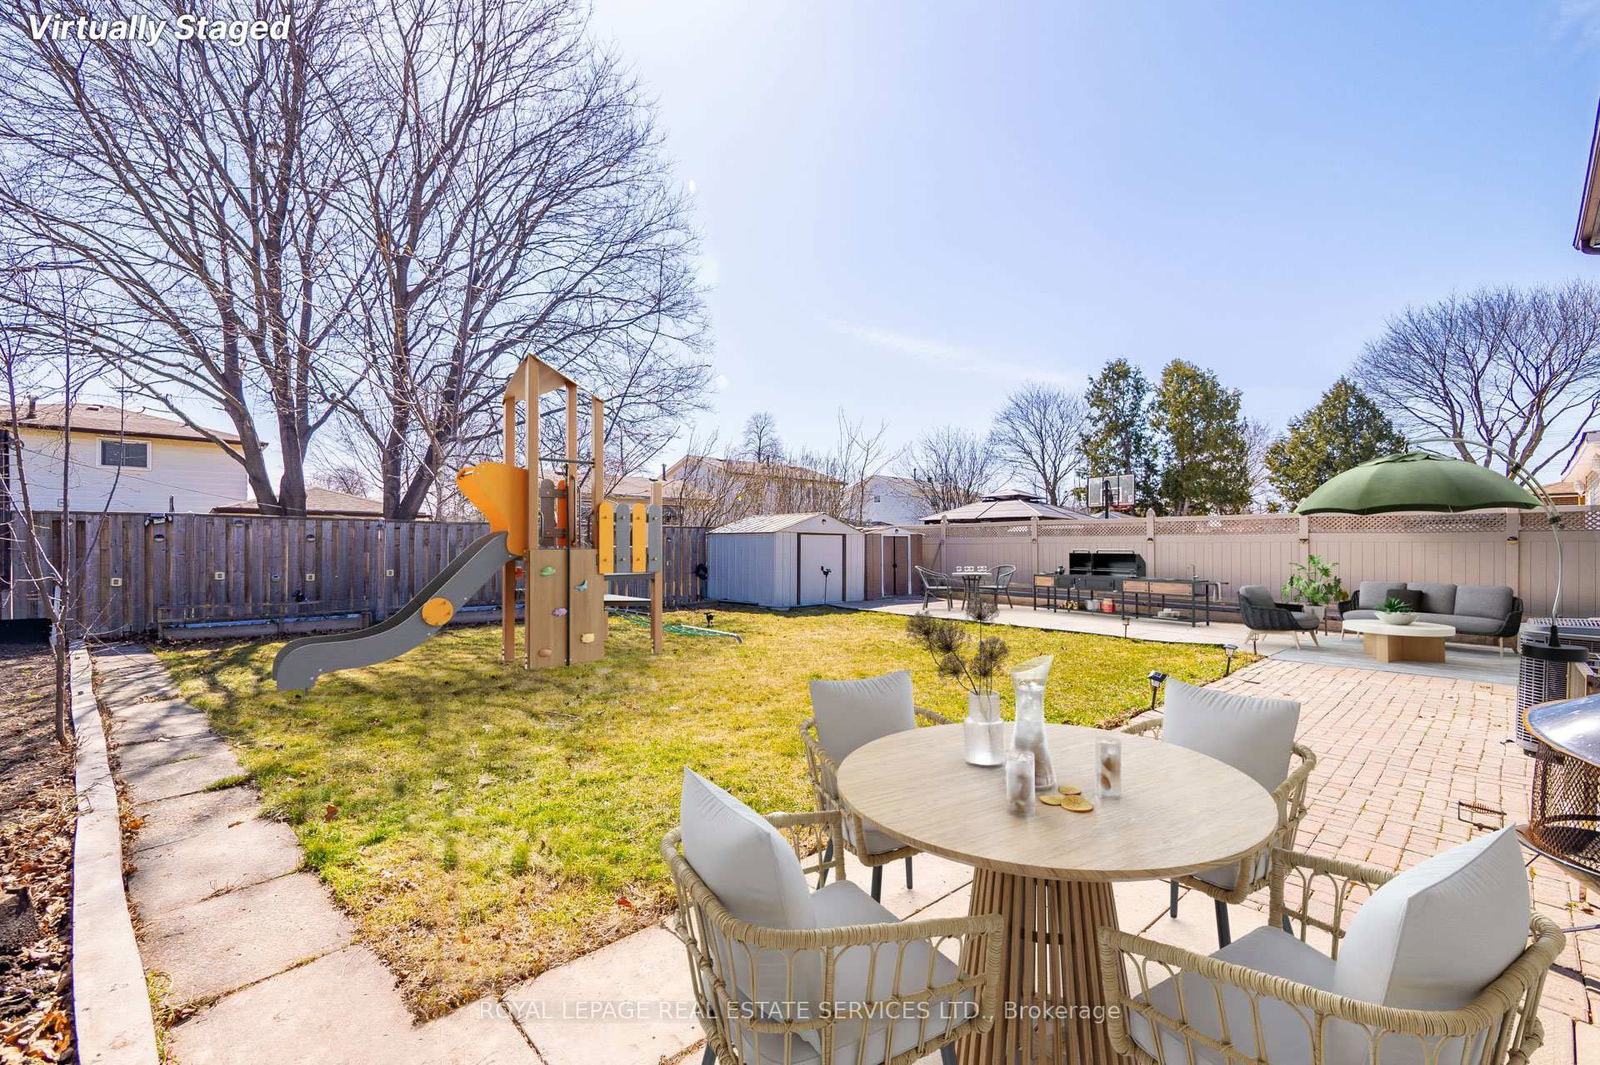
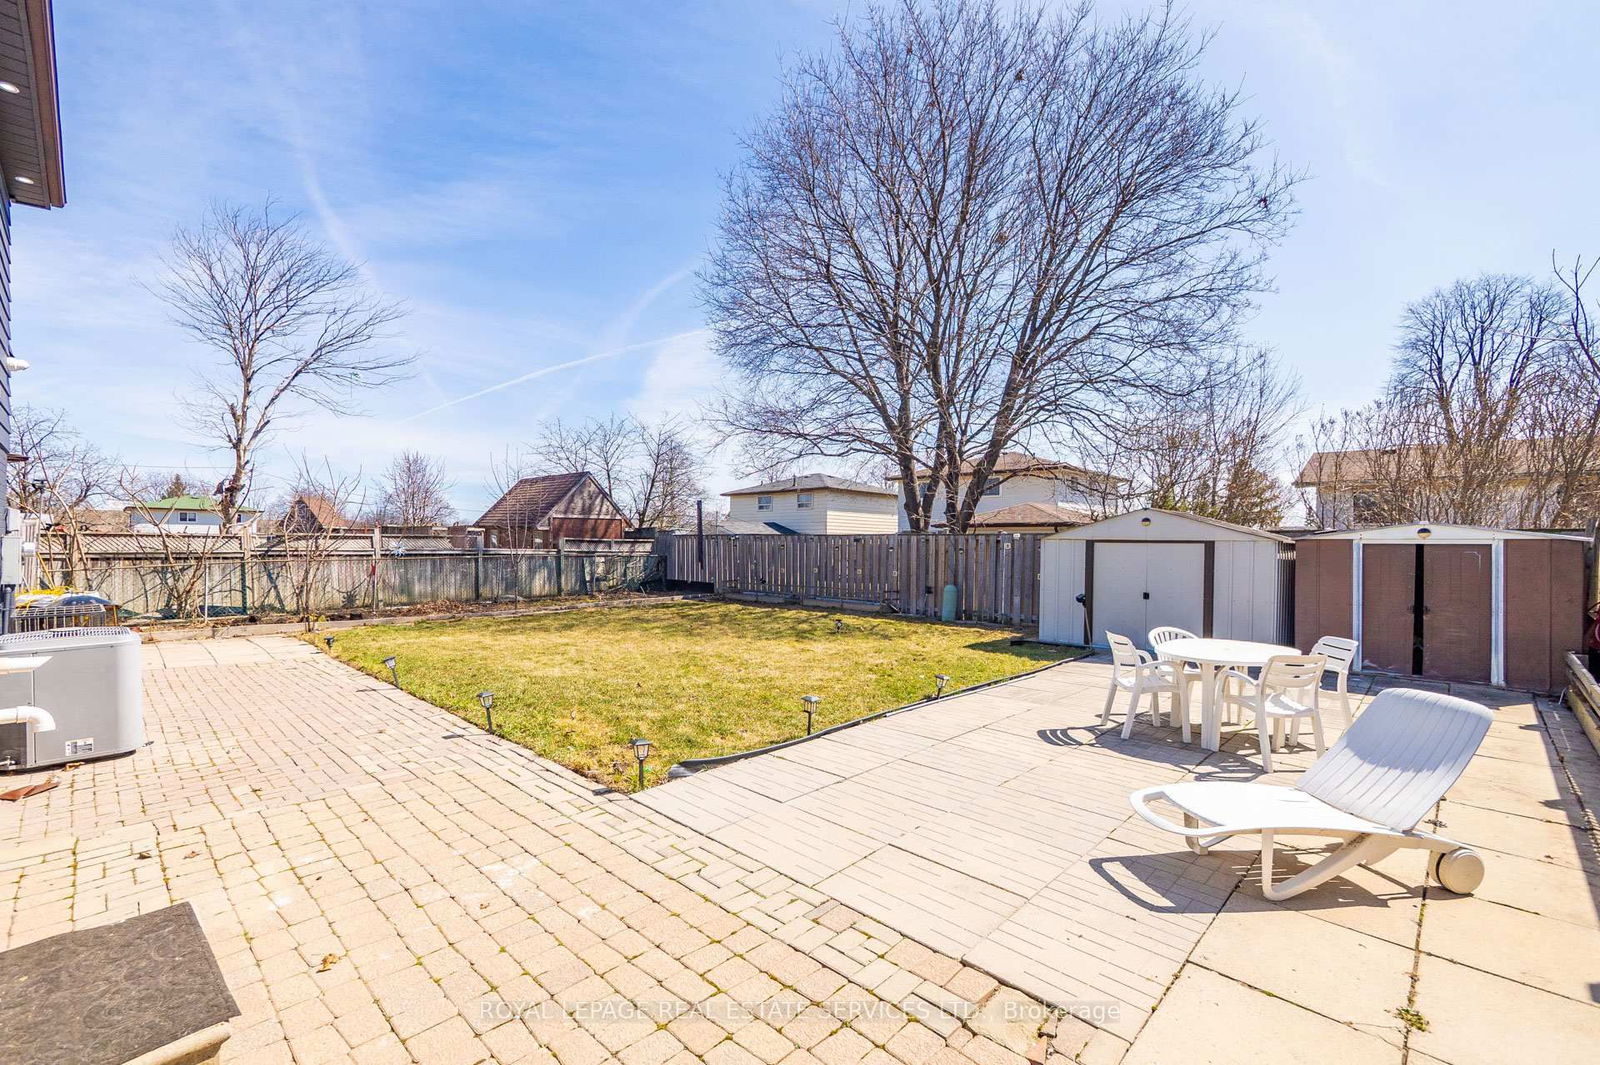
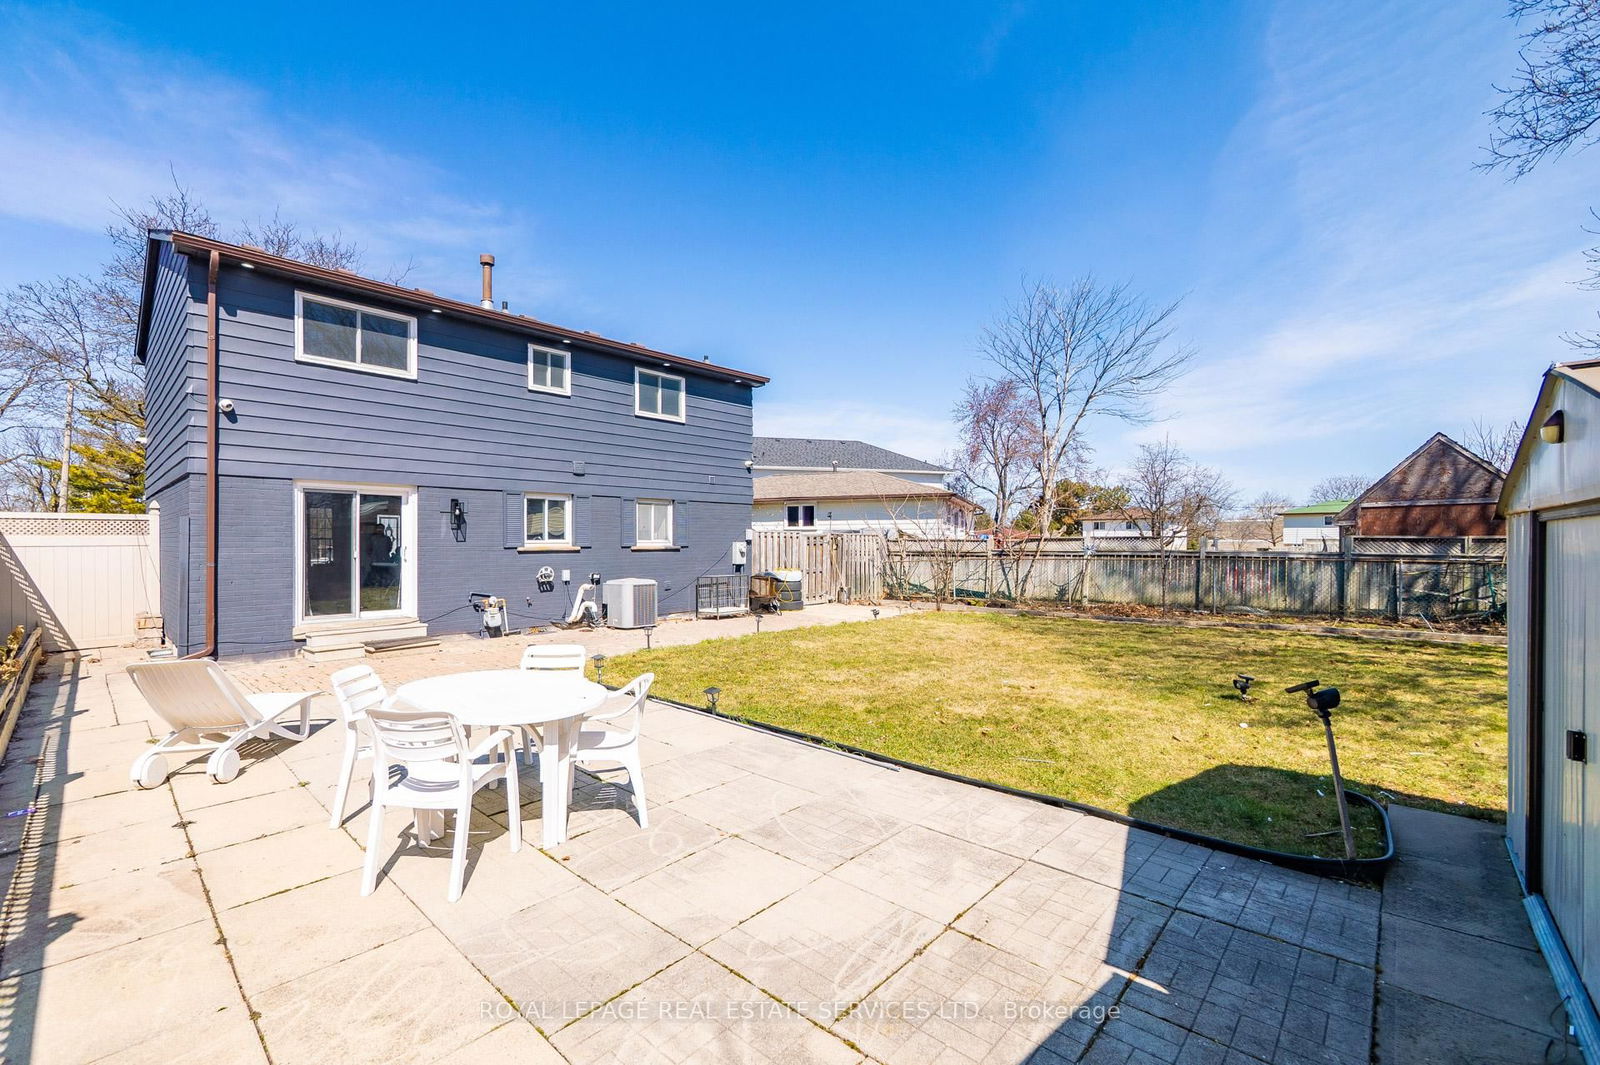
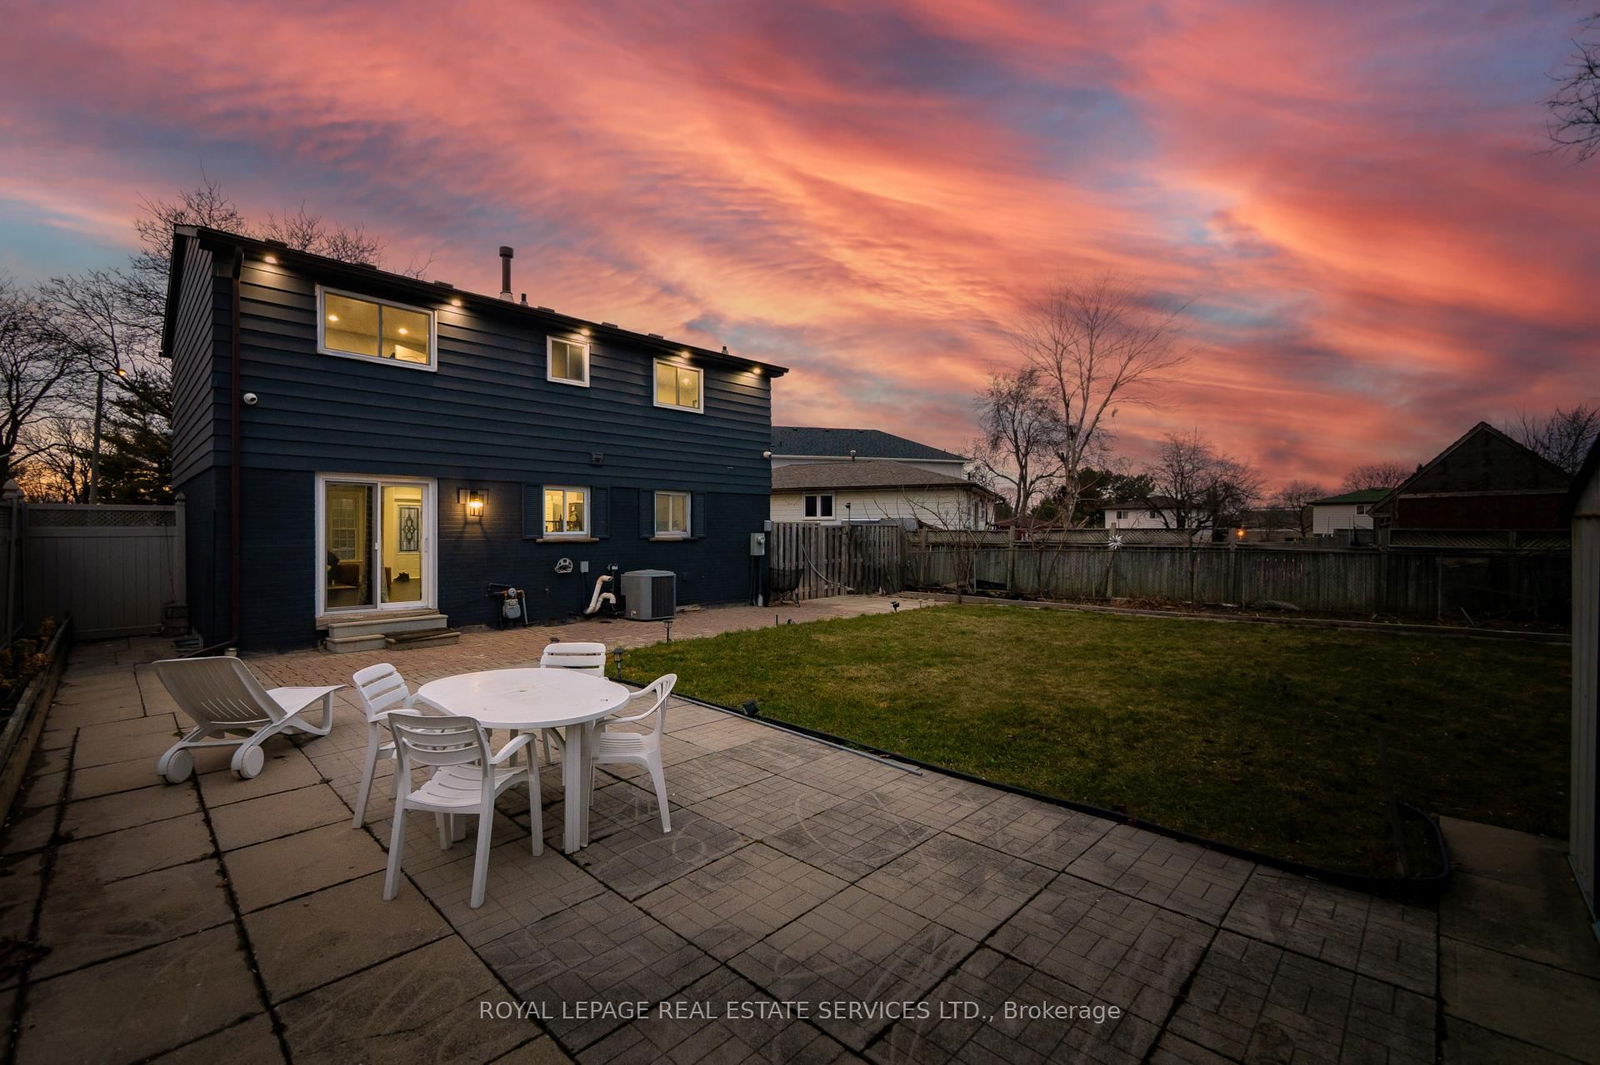
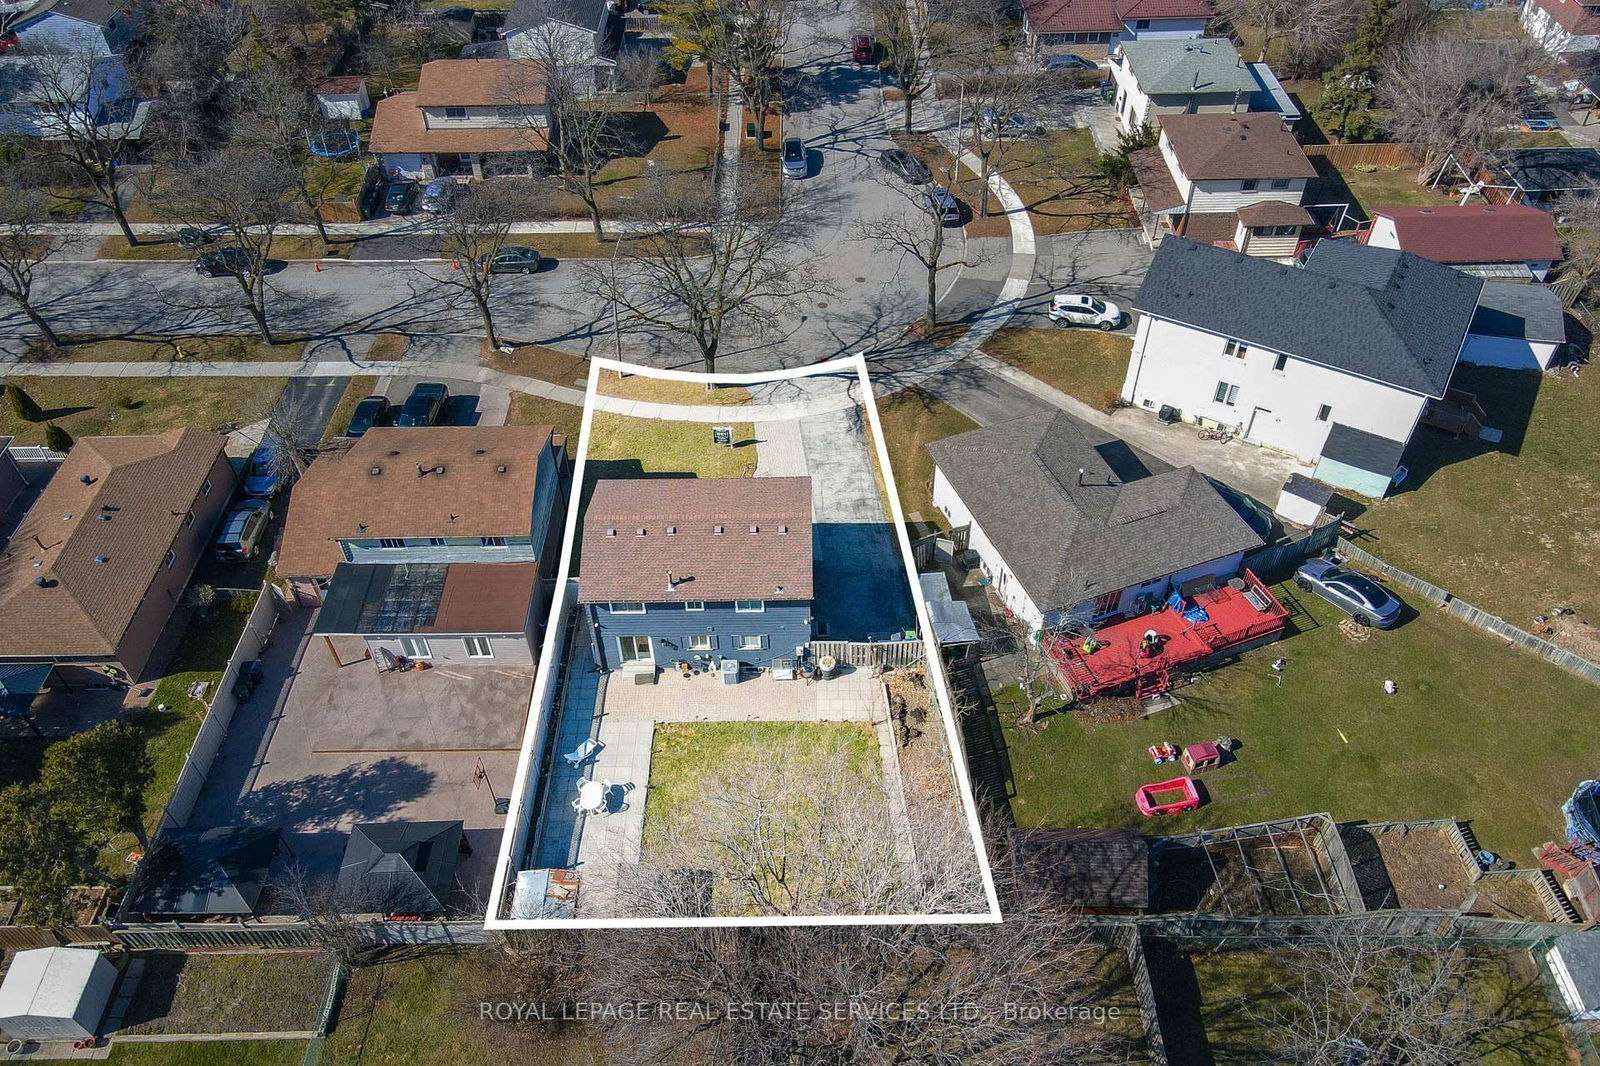
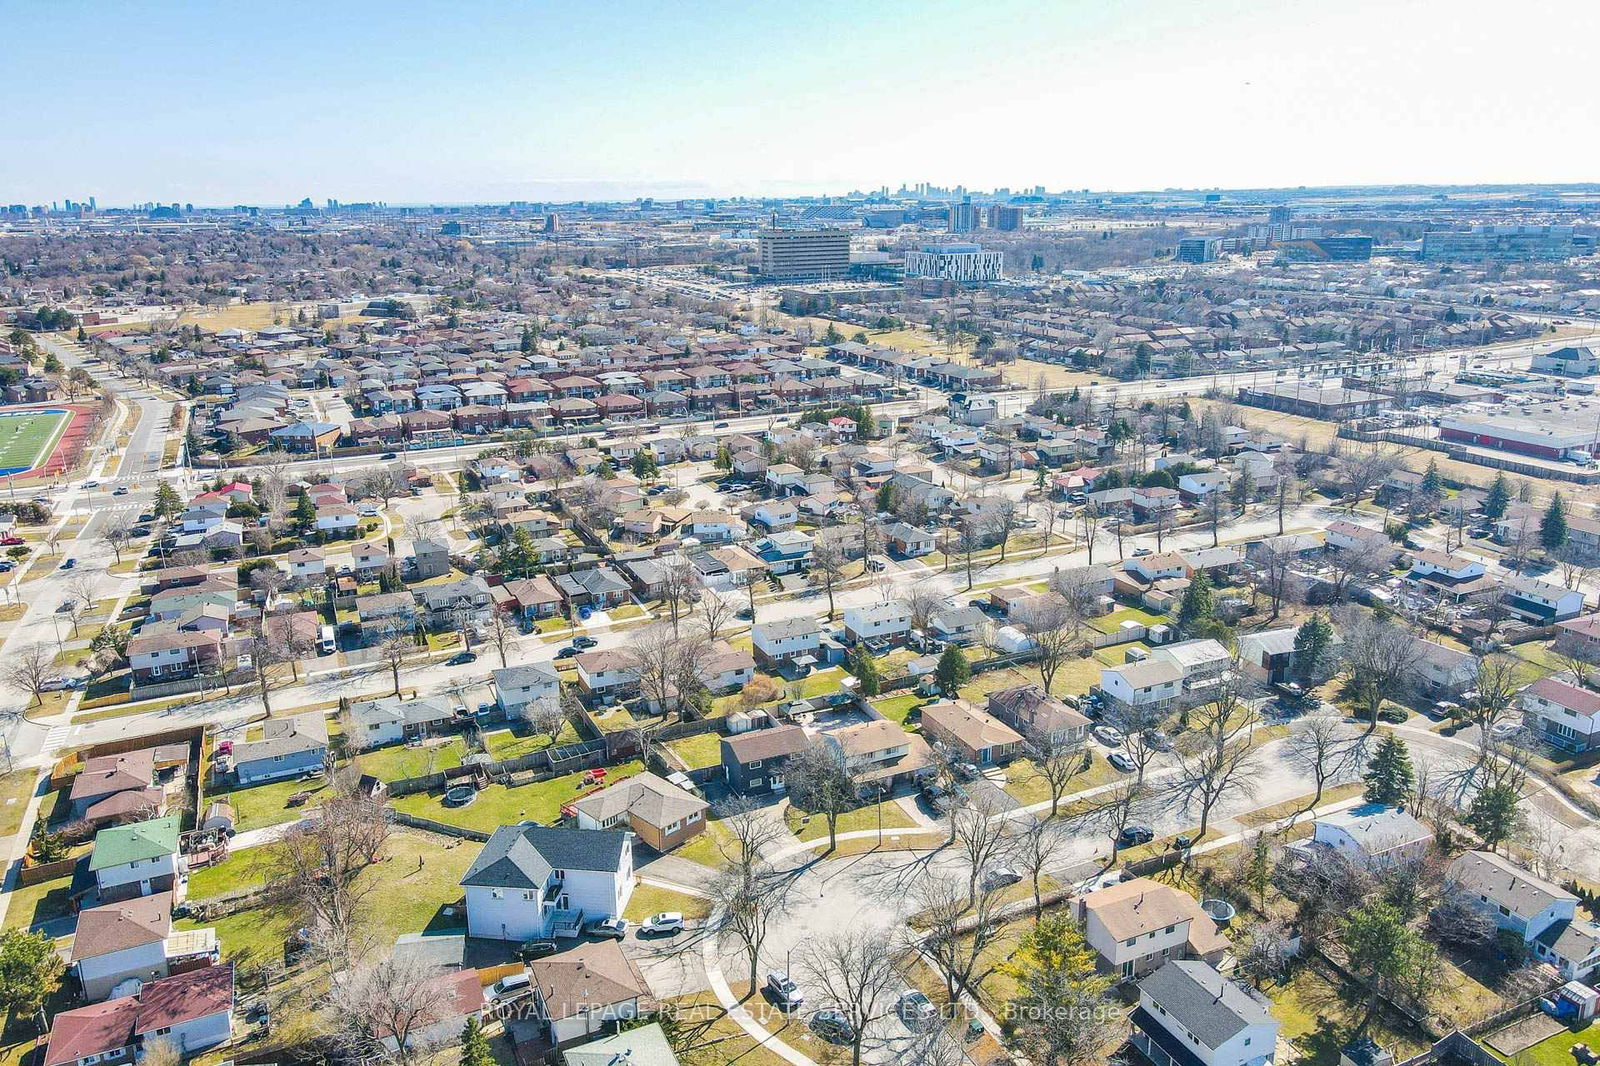
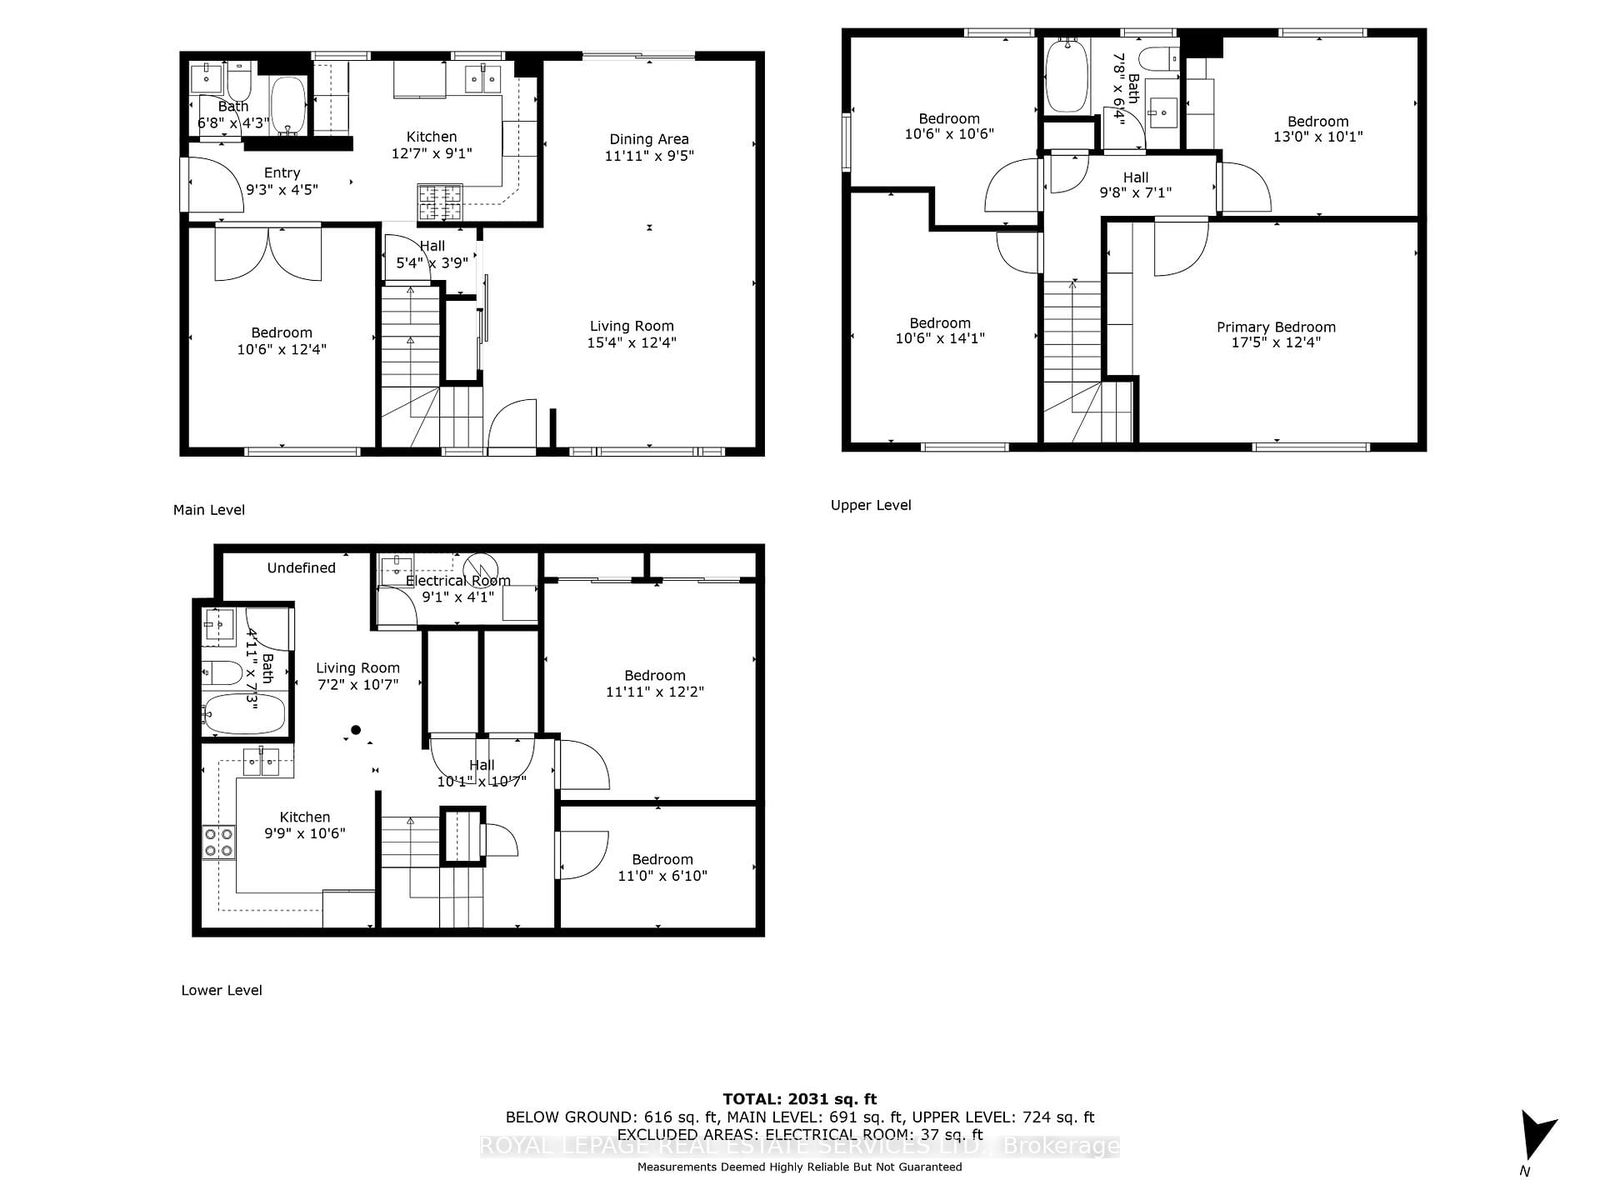
Welcome To 15 Banda Square, A Beautifully Upgraded 4+3 Bedroom Home, 2,031 Sq.ft Total Living Space Nestled On A Quiet, Family-Friendly Court. Situated On A 50x110 Ft Lot, This Home Features Parking For 4 Cars And A Large Private Backyard, Perfect For Entertaining. Inside, The Main Level Boasts Hardwood Floors, A Renovated 2022 Kitchen With New Floors, Cabinets, And Appliances, Along With Pot Lights And Smooth Ceilings. A Custom TV Wall Façade (2025) And Built-In Ceiling Speakers Enhance The Living Space With More Pot Lights Illuminating The Entire Home. A Main-Level Bedroom (Or Office/Den), Side Entrance, And A 4-Piece Bath Add Convenience And Flexibility. Upstairs, Enjoy Hardwood Floors (2022), Spacious Bedrooms, And A Renovated 4-Piece Bathroom (2024-2025). The Renovated Lower Level (2013) Features A Kitchen, Two Bedrooms, A 4-Piece Bathroom And Recently Installed Ceiling Pot lights(2025), Ideal For Extended Family Or Rental Potential (Not Legal). Key Exterior Upgrades Include New Soffit Lighting (2025), A Security System (2025, 6 Cameras), Painted Aluminum And Brick (2025), Eavestroughs (2018), And Interlock Landscaping (2017, $10K Investment). Located Minutes From Humber College, William Osler Hospital, University Of Guelph-Humber, Woodbine Centre, Parks, Trails, And Shopping, With Easy Access To Highways 27, 427, 401, And Pearson Airport. A Perfect Home For Families Or Investors!
All Electronic Light Fixtures, All Window Coverings, 2 x Fridge, 1 x Gas Stove, 1 x Electric Stove, 1 x Dishwasher, Washer/Dryer, 2 x Sheds, Shelving, 1 x Ecobee Thermostat.
Kitchen
Dining
Living
5th Br
Bathroom
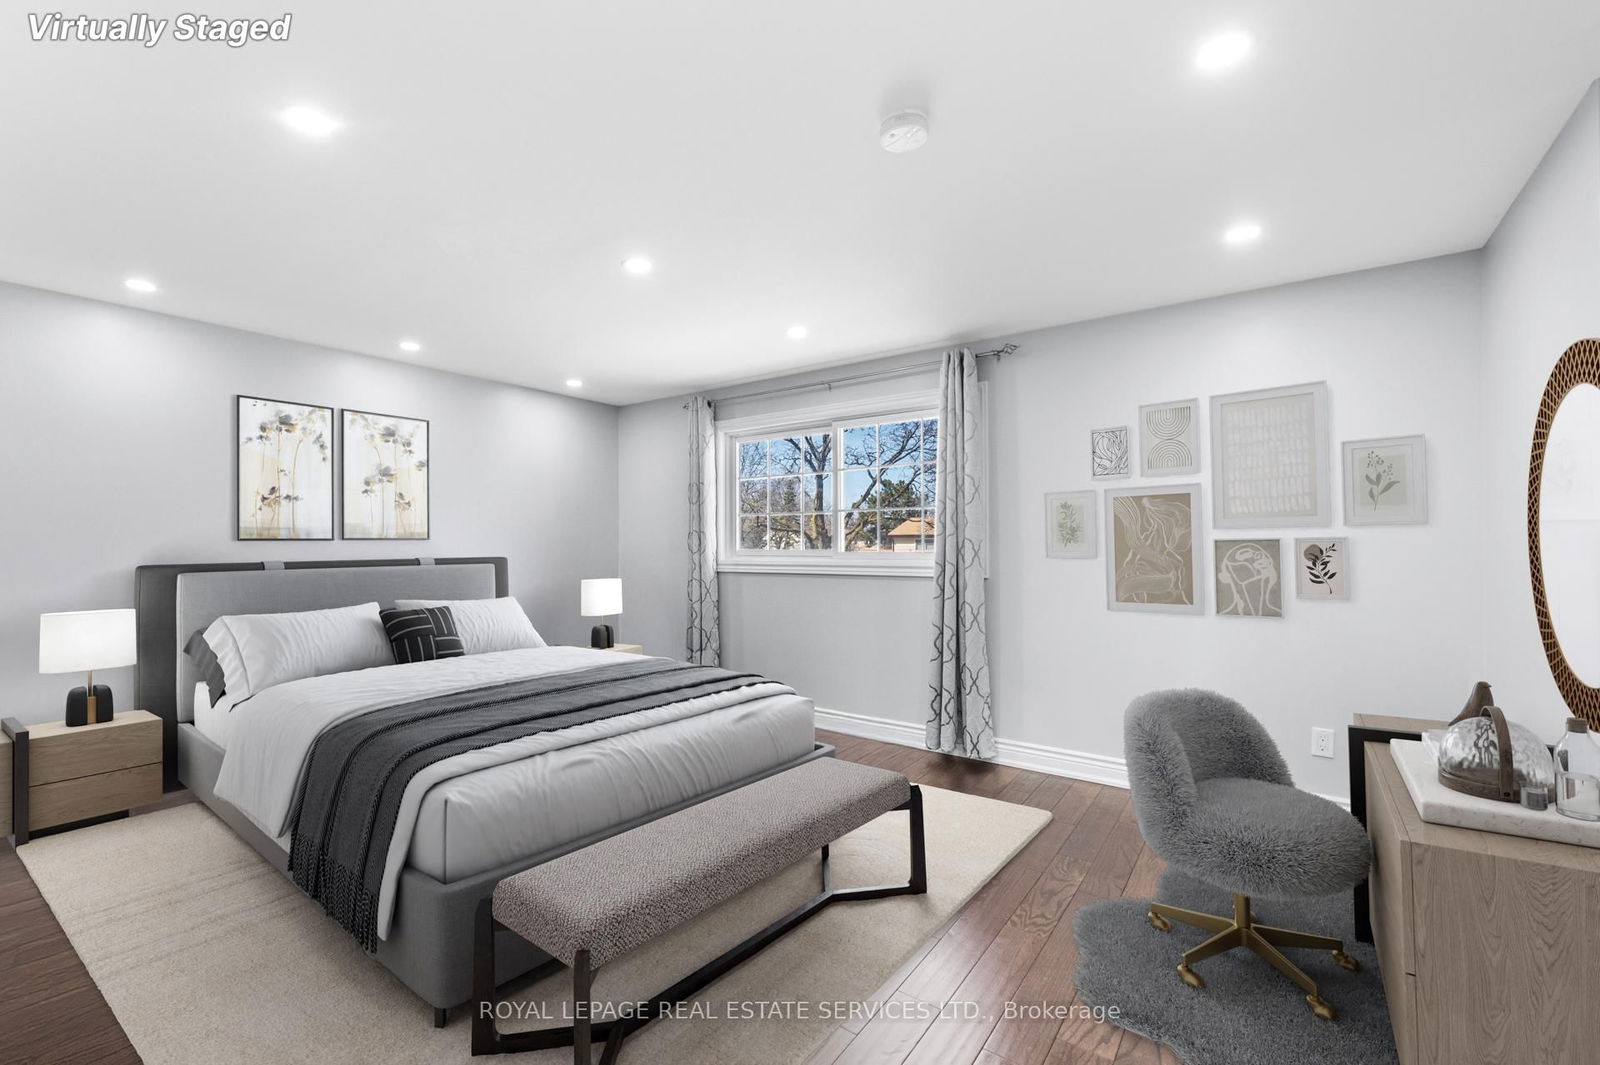
Primary
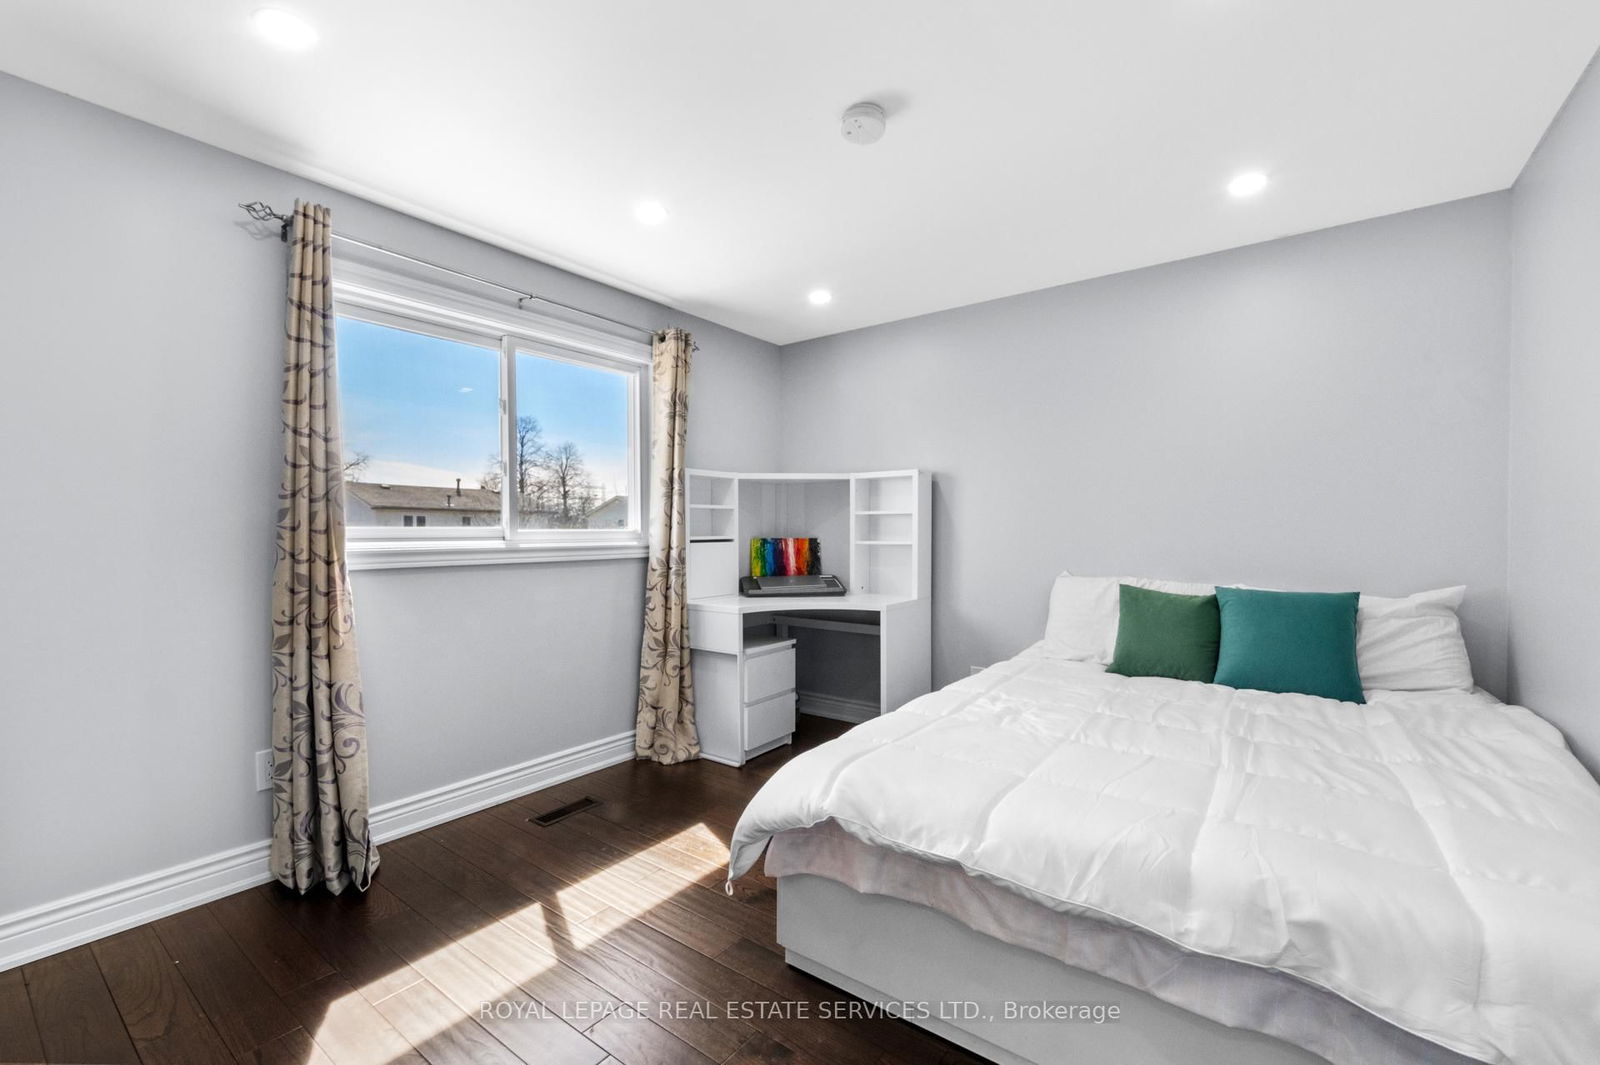
2nd Br
3rd Br
4th Br
Bathroom
Br
Br
Bathroom
Kitchen
The graph below compares the average list price and average sale price of homes in this neighborhood by month for the last 24 months. When average sale price is greater than average list price, this may suggest a buyer's market. When average sale price is lower than the average list price this may suggest a seller's market.
The graph below illustrates the average days on market for homes in this neighborhood. The yellow area may indicate a buyer's market, the green area may indicate a balanced market and the red area may indicate a seller's market.
Sales Representative, Century 21 People’s Choice Realty Inc., Brokerage
(647) 576 - 2100
Toronto, West Humber-Clairville, M9W 6G7
Toronto, West Humber-Clairville, M9V 2H9